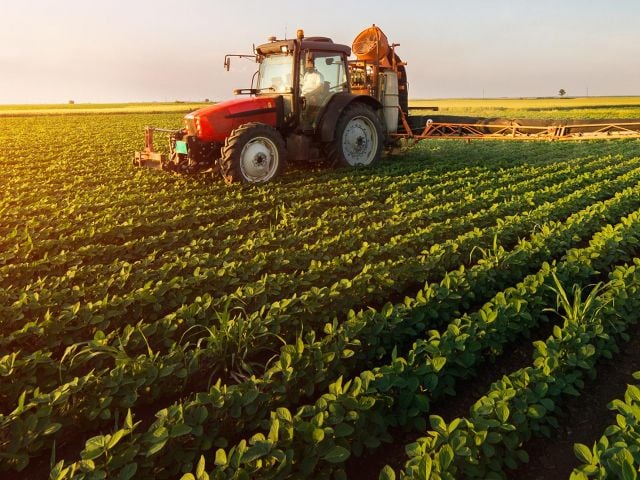
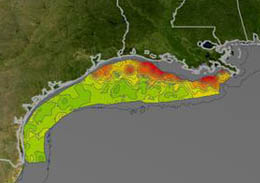
 It is one of the toughest environmental problems facing America. For over 20 years, scientists have documented the appearance of a summertime "Dead Zone" that all but obliterates marine life in what is arguably the nation's most important fishery, the Gulf of Mexico. Each year the Dead Zone grows to an area that is roughly the size of New Jersey - ranging from 5,000 to 8,000 square miles. The main culprit: an annual flood of wasted fertilizer from heavily farmed land, running off into rivers and finally into the Gulf, where it feeds the development of massive algae blooms. The algae then die and decompose, robbing the water of oxygen and suffocating all life that cannot leave the area.
In the wake of last summer's hurricanes, many wonder how much more environmental abuse the Gulf and its invaluable fishery can withstand. But there is good news.
A new Environmental Working Group (EWG) analysis of government and industry data shows that simple, targeted reforms of wasteful federal farm programs could make a significant dent in the Dead Zone while improving the bottom line for family farms throughout the Mississippi River Basin.
We found that the vast majority of fertilizer pollution comes from a relatively small area of heavily subsidized cropland along the Mississippi and its tributaries where taxpayer funded commodity spending overwhelms water quality related conservation spending by more than 500 to 1. Shifting a modest portion of commodity subsidies, particularly the portion that goes to the largest and wealthiest growers, into programs that encourage more careful fertilizer use, wetland restoration and the planting of streamside buffers of grass and trees to absorb runoff, could reduce dead zone pollution significantly while also boosting the bottom line for family farms.
Subsidizing fertilizer pollution and the Dead Zone
The EWG analysis, an update of fertilizer run-off modeling that was conducted for the Mississippi River Basin (MRB) in the early 1990s, shows that at current prices, farmers flush more than one third of a billion dollars of nitrogen fertilizer down the Mississippi River each spring. This annual surge of nitrate fertilizer pollution is responsible for more than 70 percent of the total nitrate pollution entering the Gulf in the crucial spring months prior to the formation of the Dead Zone. In contrast, municipal sewage accounts for about 11 percent, animal waste about 12 percent, and atmospheric deposition about 6 percent.
No meaningful progress has been made in the past 15 years in reducing this annual rush of agricultural pollution to the Gulf. Instead, taxpayers have unintentionally aggravated the problem by pouring billions of dollars in farm subsidies into the region. This taxpayer funded, guaranteed income has encouraged excessive use of fertilizer to produce surplus quantities of corn, rice, cotton and other subsidized commodities. From 1990 through 2002, total nitrogen fertilizer application in the MRB increased by 2 billion pounds, from about 14 billion to 16 billion pounds annually. A significant portion of this fertilizer is wasted and ends up in the Mississippi River and eventually the Gulf of Mexico. EWG's analysis found that:
- In the peak spring pollution period, 7.8 million pounds of fertilizer nitrate a day leaves the Mississippi River Basin, bound for the Gulf of Mexico.
- From 1998 through 2002, an average of $270 million dollars worth of nitrogen fertilizer was flushed down the Mississippi River in the spring of each year. At current fertilizer prices, the value of fertilizer lost down the Mississippi River each year is well over a third of a billion dollars - $391,000,000.
Pollution and subsidies concentrated in the same region
Yet this problem is readily manageable. EWG research shows that nitrate pollution is disproportionately concentrated in a small portion of the MRB, and that crop subsidies, particularly corn payments, are concentrated in this region as well. At the same time, counties in this region have relatively less land enrolled in conservation programs than elsewhere in the MRB. This convergence suggests that a simple, common-sense reform of the way we spend tax dollars, to support targeted application of improved farming practices will produce significant and cost-effective long-term gains in water quality, and help restore the Gulf.
We found that:
- Farms in counties that comprise just 15 percent of the total land area of the Mississippi River Basin are responsible for 80 percent of the critical spring surge of agricultural nitrate pollution to the Gulf.
- From 1995 through 2002, $28 billion out of $59.7 billion, or nearly half of all subsidies in the MRB went to these counties that comprise just 15 percent of the MRB.
- Farms in 124 counties that account for just five percent of the land area in the MRB account for 40 percent of spring nitrate fertilizer pollution in the Gulf. These top polluting counties in Illinois, eastern Iowa, western Indiana, northeastern Arkansas and southeastern Missouri, received $11.4 billion in subsidies from 1995 through 2002.
In the top polluting counties, far more money is spent on wasteful commodity subsidies, than proven water quality related conservation programs. For the Wetland Reserve Program, the Environmental Quality Incentive Programs and the Riparian and Wetland components of the Conservation Reserve Program:
- Crop subsidy payments were about 500 times greater than conservation payments in the 124 counties that account for 40 percent of spring nitrate fertilizer pollution, with just $22.5 million in water quality payments compared to $11.4 billion in crop subsidies.
- At the county level, payment disparities of 1,000 to 1 are common, with some counties in the high polluting region getting 10,000 times more in crop subsidies than water quality conservation dollars.
- In counties with the highest fertilizer runoff, the proportion of land enrolled in conservation programs drops as the proportion of land in fertilized agriculture increases - just the opposite of what is needed to reduce nitrate pollution.
Environmental incentive programs under-funded
Many farmers are concerned about fertilizer pollution and want to do something about it. In fact, in the top polluting regions of the MRB thousands of farmers have signed up for existing federal programs that support clean water, best management practices, and conservation, only to be turned away because money is being spent on traditional subsidy programs.
- In the top nitrate fertilizer polluting states of Illinois, Indiana and Iowa, $235 million in conservation and water quality grants for more than 11,000 farmers went unfunded under the Environmental Quality Incentive Program (EQIP) in 2004. This is more than four times the value of funded EQIP projects in those states in that year, some $52 million. Crop subsidies in those states, which in general encourage excessive nutrient use, totaled more than $2.7 billion in 2004.
- In the 14 states where the 15 percent of high polluting counties are located, EQIP requests from 55,100 farmers valued at more than $832 million were unfunded in the same year.
- Wetland restoration and preservation programs fared no better. In 2004, 2,450 farmers were unable to enroll 321,000 acres in the Wetlands Reserve Program (WRP) due to a $411 million shortfall in WRP funding.
Focusing resources on reducing fertilizer runoff in these hotspots through wetland restoration, streamside easements and better nutrient management on working farm lands will improve local water quality, restore stream and river banks, help control floodwaters, and ultimately reduce the size of the Dead Zone in the Gulf of Mexico. Currently, however, trends are in the opposite direction. In the nitrate pollution hotspots identified in this analysis, less than 3 percent of the acreage is enrolled in any kind of conservation program. Overall, acres set aside for conservation in the MRB have declined over 30 percent since their peak in 1993.
Recommendations
Taxpayers should not be forced to subsidize agricultural production that contributes to the Dead Zone in the Gulf of Mexico nor the pollution of the Mississippi River. At the same time, pollution control strategies must recognize that much of the highly polluting acreage is also some of the most highly productive land in the nation. Policy makers must be strategic about conservation decisions and blend a combination of nutrient management requirements with well-funded opportunities for easements and riparian and wetland reserves.
Taxpayers spend $500 dollars subsidizing fertilizer pollution through direct commodity payments for every dollar they spend to prevent it. As a result, less than three percent of the farmed land in the pollution hotspots identified in this analysis is enrolled in any federal conservation program, and this figure includes the Conservaton Reserve Lands. The main reason for this dismal participation rate is lack of funds, not lack of farmer interest.
- Funding for EQIP the WRP and related water quality improvement and protection programs must be increased dramatically to help growers protect critical buffer zones, wetlands, and riparian areas.
There is also a glaring need to improve nitrogen management practices. Recent data from USDA shows that farmers who test their soil for nitrate apply about 4 percent less nitrogen per acre than those who don't, but that only about 17 percent of acres are currently tested. Farmers have no incentive to optimize fertilizer applications because nitrogen is a relatively minor input cost, even with rising energy prices, and because nearly all farmers in the MRB are cushioned in the marketplace by generous taxpayer subsidies.
- After a phase-in period to ensure that capacity is available, nutrient management plans must be required as a condition of receiving taxpayer subsidies in the 15 percent of counties in the MRB that account for 80 percent of spring fertilizer runoff surge to the Gulf.
A combination of improved fertilizer management, easements, and restoring riparian buffers, wetlands and pasture on as little as 3 percent of the land area of the MRB would dramatically reduce N loading to the Mississippi River, its tributaries, and ultimately the Gulf of Mexico. By redirecting some of the money now spent on commodity payments to conservation payments, US farm policy can be brought into line with government objectives to protect fisheries and marine systems in the Gulf of Mexico. As shown with the conservation reserve program, diversified land use provides a variety of benefits, including flood control, reduced sediment loading in streams, reduced municipal water treatment costs, improved fish habitat, carbon sequestration, and miles of connected habitat corridors for wildlife.
The Dead Zone in the Gulf is not unique — all over the world, freshwater and marine systems are experiencing unparalleled chemical and nutrient pollution that wipes out productive fisheries and leaves a legacy of decay for future generations. The Gulf region is staggering both economically and ecologically to recover from last season's hurricanes, and the added stress of a continually increasing Dead Zone will only delay the recovery, perhaps indefinitely. Leveraging the existing system of subsidies to redirect money that is already being spent toward proven conservation programs is a winning strategy for all concerned.
Methods in brief
Our objective was to build a spatial model of the relationship between nitrogen loading factors in the Mississippi River Basin and the nitrate inputs to the Gulf of Mexico. The nitrogen loading factors in the MRB include: fertilizer use, animal waste, human waste, and atmospheric nitrate deposition. We sought to characterize the extent to which each factor contributes nitrate to the Gulf, and also provide updated information on which geographic areas are the largest contributors. We then took the further step of relating patterns of land use and nitrogen loading to the system of agricultural subsidies that support "program crop" farming in the United States.
We employed standard methods of watershed analysis to examine how nitrogen use as fertilizer, and production as waste, contribute to nitrogen pollution in rivers and streams. We calculated fertilizer use with USDA crop data, checking the accuracy of our fertilizer use estimates against a commercial database of fertilizer sales in the United States. We acquired nitrate flux data from water quality monitoring sites maintained by the US Geological Survey (USGS), summed the nitrogen inputs that occurred within the drainage areas of each site, and used a statistical regression model to describe how nitrogen inputs on the land are conveyed into rivers, and ultimately into the Gulf of Mexico. We used the resulting statistical relationship to identify which areas of the MRB are the greatest sources of nitrate to the Gulf of Mexico. Finally, we used USDA agricultural subsidy data to characterize relationships between subsidies, land use, and nitrate pollution.
The regression model provided an effective description of spring nitrate flux dynamics in the MRB, accounting for about 84 percent of variation in the data. Our modeled results for the March-June runoff period of each year closely matched USGS results for measured nitrate flux to the Gulf of Mexico, and our conclusions mirrored those of other studies examining the sources of nutrient flux to the Gulf.
Background: What is the Dead Zone?
The drainage basin of the Mississippi River Basin encompasses about 41 percent of the lower 48 states, and includes the majority of the nation's crop-growing area outside of California. All rivers and streams within the MRB eventually exit into the Gulf of Mexico via either the Mississippi River, or the Atchafalaya River. The two rivers are responsible for 90-95 percent of the total freshwater discharge and nutrient load brought into the Gulf (Goolsby and Battaglin 2001, Rabalais et al. 2002b).
Since at least the mid-1980's (Rabalais et al. 2002a, Rabalais et al. 2002b, Scavia et al. 2003), it has been apparent that nitrogen carried into rivers of the MRB is fueling tremendous algal growth in the Gulf in the spring and summer months. Decomposition of this algal biomass consumes dissolved oxygen in the water column, leading to a condition of hypoxia, at which oxygen concentrations are 2 ppm or below in vast areas of the water column, for months at a time (Rabalais et al. 2002a, Rabalais et al. 2002b, Stow et al. 2005). In these conditions, very few marine organisms can survive, hence the area affected by hypoxic conditions is referred to as the "Dead Zone."
The size of the Dead Zone varies from year to year, but the most recent five-year average for 2001-2005 puts it at about 6,000 square miles (N.N. Rabalais, pers. comm.) and in 2002 it was nearly 8,000 square miles (Rabalais et al. 2002a). Hypoxic conditions and pollution in the Dead Zone damage fisheries and estuarine systems important for fish and shellfish hatcheries (Diaz and Rosenberg 1995), and nutrient enrichment in the waterways of the MRB damages freshwater fisheries and threatens drinking water supplies. Hypoxia due to nutrient enrichment is a growing problem around the world (Boesch and Brinsfield 2000, Diaz 2001), but the extent of the area affected by hypoxia and the importance of the fisheries threatened put the Gulf Dead Zone in a class by itself.
While technological solutions continue to improve controls over municipal and industrial waste inputs to aquatic systems, and these point discharges come under Clean Water Act regulation, there has been little improvement in agricultural and so-called nonpoint pollution control. Nitrogen inputs to rivers and streams have increased dramatically in recent decades (McIsaac et al. 2001), and these inputs — particularly nitrate-nitrogen — have repeatedly been identified as the main cause of Gulf hypoxia (Mitsch et al. 1999, Rabalais et al. 2002a, Rabalais et al. 2002b).
A second condition important to development of the Dead Zone is the discharge of freshwater into the salty waters of the Gulf. Fresh water is less dense, and floats on top of the salt water, preventing oxygen recharge to lower waters (Rabalais et al. 2002a). Modifications to the Mississippi that have increased the volume of water discharging to the Gulf by straightening and channelizing the river, thereby bypassing riverine wetlands that could help remove nitrogen, have no doubt set up the conditions that favor the development of hypoxia. However, major modifications to the river were completed in the 1950's, well before hypoxia in the Gulf became the large problem that it is now (Rabalais et al. 2002b), and modeled results that separately estimate the contributions of hydrology and nitrogen inputs to nitrate flux conclude that increases in river discharge only account for about 25 percent of the increase in nitrate loading for the years 1966-1994 (Donner et al. 2002). Presently, the size of the Dead Zone is coupled with the amount of freshwater entering the Gulf. Greater discharges of freshwater not only expand the area of the Dead Zone but as flow increases, nitrate concentrations in the Mississippi River actually increase as well because nitrogen stored in soils and groundwater is mobilized and conveyed to rivers and streams.
Several studies have used models of varying complexity to characterize the nitrogen sources that drive formation of the Dead Zone (Smith et al. 1997, Burkart and James 1999, Goolsby et al. 1999, Alexander et al. 2000a, Goolsby and Battaglin 2001, McIsaac et al. 2001, Donner 2003, Donner and Kucharik 2003, Donner et al. 2004). Models typically consider fertilizer runoff, decomposed crop residues, human waste, animal waste, and atmospheric nitrogen deposition to be the major sources of nitrogen in rivers and streams. Water monitoring data show that while discharge of organic nitrogen has remained essentially constant since the early 1970s (Rabalais et al. 2002a), discharge of inorganic nitrogen, particularly nitrate, has strongly increased over the same period (Goolsby et al. 1999, Goolsby and Battaglin 2001, Goolsby et al. 2001, McIsaac et al. 2001), coincident with increased use of inorganic fertilizers, although some of the increase may also be attributed to increased runoff since the mid-1950s (Goolsby et al. 2001). In addition, the seasonality of nitrate runoff has changed, with runoff showing an increasing peak around May since the 1990s (Donner et al. 2004).
All studies agree that inorganic nitrogen runoff from fertilizer is the predominant source of nitrogen to rivers and streams in the MRB, with nitrate and total N discharge roughly co-varying with the extent of the Dead Zone (Lohrenz et al. 1997, Rabalais et al. 2002a, Rabalais et al. 2002b, Scavia et al. 2003, Scavia et al. 2004, Turner et al. 2006). Precipitation and runoff are important determinants of the amount of nonpoint nitrate conveyed from the land into rivers and streams, as nitrogen stored in soils and groundwater is mobilized and conveyed to surface waters (Goolsby et al. 1999). Nitrate loading tends to be highest in the spring (David et al. 1997, Lohrenz et al. 1997, Goolsby et al. 1999, Goolsby et al. 2001), due to the period of high precipitation coinciding with the period when fertilizer use is highest. Nitrate constitutes an increasing proportion of total nitrogen in runoff as agricultural land use increases (McIsaac et al. 2002, Donner 2003). Using two different approaches, Donner et al. (2002) and Justic et al. (2003) agreed that only 20 to 25 percent of the increased nitrate flux between the mid-1960s to the mid-1990s was attributable to greater runoff and river discharge, with the rest due to increased nitrogen loading onto the landscape. With nitrate concentrations in the lower Mississippi River remaining fairly constant since the early 1990s (Turner et al. 1998), formation of seasonal hypoxia now depends to a large extent on climate-driven changes in discharge.
Estimating the reduction in nitrogen loading required to shrink the size of the Dead Zone is complex, because the size of the Dead Zone depends not only on runoff and nutrient inputs, but also on a variety of factors in the marine environment (Lohrenz et al. 1997, Rabalais et al. 2002a, Rabalais et al. 2002b, Stow et al. 2005). Scavia et al (2003) conclude that a 30 percent reduction in total nitrogen inputs would shrink the Dead Zone by 20-60 percent, but that in most years, this may not be sufficient to meet the stated goal of the 2001 Gulf Hypoxia Assessment's Action Plan, which is to shrink the average size of the Dead Zone to about 2,000 square miles. Because nitrogen use and inputs are constantly increasing, and precipitation and runoff have been increasing (Lins and Slack 2005), there is a tremendous amount of nitrogen now stored in soils and groundwater that remains to be released during high runoff events (Scavia et al. 2004). However, despite the uncertainty in the magnitude of needed nitrogen input reductions to the Gulf, even a small reduction, according to the Mississippi River/Gulf of Mexico Nutrient Task Force (2001), could greatly improve water quality.
Government response to the Dead Zone
There is near unanimity in the scientific community that the most effective way to reduce the size of the Gulf Dead Zone is to reduce non-point nitrogen loading to aquatic systems (Mitsch et al. 1999, 2001). In 1997, the White House Office of Science and Technology Policy commissioned the US Department of Commerce, in conjunction with National Oceanic and Atmospheric Administration (NOAA), the National Ocean Service, the National Centers for Coastal Ocean Science, and the Center for Sponsored Coastal Ocean Research, to produce a series of reports that would characterize the problem of Gulf hypoxia and suggest solutions for remediation (Goolsby et al. 1999). This charge led to a series of reports and publication of an "Action Plan" (Mississippi River/Gulf of Mexico Nutrient Task Force 2001), which as of 2005 was put under the first of its scheduled five-year reviews. The Action Plan is mostly a call for voluntary efforts on the part of farmers and agribusinesses to use best management practices to prevent fertilizer runoff from farmed lands. Documentation for the first of the five-year reassessments, posted on the web in December 2005 (see below for relevant links), makes it painfully clear that little progress has been achieved toward stated goals of the Action Plan.
Our approach
EWG's work had two major objectives. We wanted to use current land use and water quality data to characterize sources of nitrate flux to the Gulf, and to identify which areas of the MRB are disproportionately contributing spring nitrate pollution to the Dead Zone. Going further, however, we wanted to investigate the relationship between government agricultural policy and the Dead Zone, as mediated through agricultural subsidies to farmers. To this end, we investigated the role of agricultural subsidies in promoting farming practices that increase nitrate loading to the Gulf, and explored the effectiveness of government conservation programs in promoting cleaner water.
Report findings
Without action, the Dead Zone will continue to increase in size
Nitrogen inputs to the Gulf of Mexico have not diminished since 1990, and there has been no abatement of the problem in the five years since the 2001 Gulf Hypoxia report was issued by the government. Since 1990, the major nitrogen loading factors in the MRB have remained level or increased, while mitigating factors have decreased. Fertilized acres have increased, fertilizer use has increased, total atmospheric nitrogen deposition has increased, and population has increased. In 2002, over 16 billion pounds of fertilizer nitrogen were applied in the MRB. Meanwhile, the amount of land set aside for conservation has decreased.

Of these factors, fertilizer inputs are the most significant input of nitrogen to rivers and streams of the MRB, and in fact, actual fertilizer application rates are probably even higher than we have estimated them to be in this study. We compared our fertilizer use estimates, which were based on USDA cropping data multiplied by USDA state-level fertilization rates, to industry data on actual fertilizer sales. Fertilizer sales data are unavailable for some states, so it is not possible to estimate the trend of total sales in the MRB, but we were able to perform state-by-state, county-by-county comparisons of the two databases for the most important agricultural states. Even after subtracting non-agricultural fertilizer sales, state-level fertilizer sales figures significantly exceeded our estimates of fertilizer use in most cases.
Fertilizer runoff accounts for the majority of spring nitrate flux to the Gulf
Our analysis shows that fertilizer runoff is the dominant source of nitrate to the Gulf in the spring, contributing around 70 percent of the total and accounting for about 7.8 million pounds of nitrate-nitrogen per day during the peak loading period. By the time this nitrate reaches the Gulf, losses due to denitrification have reduced the fertilizer load to about 5.4 million pounds. Municipal waste sources account for about 11 percent of nitrate loading, atmospheric nitrate deposition for about 6 percent, and animal waste for about 12 percent.
Consideration of some nitrogen flux estimates from other sources helps put these findings in perspective. A 1996 EPA estimate for total N discharged from all point sources (i.e. municipal and industrial) in the MRB was 642 million lb as total N in a year (Tetra Tech, 1998). Expressed as a daily flux, this value would only account for a fraction of daily nitrate flux to the Gulf in the spring, even if all the municipal nitrogen was produced as a nitrate, which it is not (Mueller and Helsel 1996). However, while the importance of point source loadings to the Gulf is less than nonpoint source loadings, the importance of municipal and industrial discharges to local water quality and ecosystem health should not be downplayed. These sources of nutrient pollution occur year-round, and can be the dominant source of nutrient inputs in watersheds with a high population density.
Similarly, animal wastes from confined animal feeding operations are important point sources of nitrogen to local water supplies, but in the context of fertilizer applications, these inputs are relatively small contributors to net nitrogen flux to the Gulf. While yearly production of nitrogen in animal waste is about 38 percent of nitrogen applied as fertilizer, animal waste production is distributed throughout the year, unlike fertilizer application, which occurs during discrete periods of the fall and spring. Additionally, a large amount of nitrogen in animal wastes can be lost to the atmosphere via ammonia volatilization (Meisinger and Randall 1991, cited in Goolsby et al. 1999). To the extent that volatilized nitrogen is redeposited as atmospheric ammonium deposition in the same general vicinity as the concentrations of animals, its influence on water quality should presumably be detected by the model.
Yearly atmospheric nitrate deposition does not exceed about 5 lb/acre in the MRB, compared to fertilizer inputs, which averaged over the landscape can reach over 80 lb/acre. However, the overall importance of atmospheric nitrogen sources is probably more important than our model indicates. We did not include atmospheric ammonium deposition in our model, because unlike atmospheric nitrate, which is mostly derived from combustion sources, atmospheric ammonium is chiefly derived from agricultural sources (NADP 2000), and we wanted to avoid "double-counting" of these sources. Additionally, we did not include the organic component of nitrogen deposition, or dry deposition. In eastern watersheds, such as the Chesapeake Bay region, atmospheric N deposition may be an important source of N inputs to rivers and estuaries (Alexander et al. 2000b), and can be a significant threat to forest health (Driscoll et al. 2001).
A relatively small area accounts for the majority of spring nitrate pollution
Our analysis indicates that for the years 1995-2002, fertilizer runoff accounted for about 70 percent of total nitrate flux to the Gulf in the spring. In these years, farms in 5 percent of the MRB produced about 40 percent of the nitrate load from fertilizer. Farms in ten percent of the MRB accounted for 65 percent of fertilizer nitrate loading, and farms in 15 percent of the MRB were responsible for 80 percent of fertilizer nitrate loading. The areas most responsible for nitrate pollution generally have high fertilizer use rates on farmed land, and a high proportion of the total land area in fertilized agriculture, although the amount of runoff and proximity to major rivers also influence how large a source of nitrate flux any particular area is (Alexander et al. 2000a, Donner et al. 2004).
Clearly, certain areas contribute disproportionately to fertilizer runoff, and they are mostly in the Corn Belt. There are three major factors at work. First, the response of riverine nitrate flux to fertilizer inputs on a whole watershed basis shows a threshold, occurring around 30 lb/acre, at which nitrate flux becomes abruptly worse. If fertilizer use is expressed in terms of the proportion of total watershed acres under fertilized agriculture, the threshold occurs between 30-40 percent. Conceiving the landscape and its rivers and streams as a sponge that soaks up fertilizer runoff, with unfertilized areas and wetlands "buffering" inputs to rivers by incorporating nitrogen biologically or facilitating its transformation to gaseous forms via denitrification, then there is clearly a point where the sponge is saturated, and begins to discharge nitrate. Destruction of wetlands and riparian forests especially reduces the capacity of the watershed to protect rivers and streams from nutrient inputs. However, similar threshold dynamics have been observed in other systems where land conversion was not the issue. Experimental evidence suggests a threshold can arise because of limited ecosystem capacity to absorb added nitrogen (Johnson 1992, Perakis et al. 2005), and the phenomenon of "nitrogen saturation" from atmospheric deposition is well documented in the US and in Europe (Tietema et al. 1998, Lovett et al. 2000, Fenn et al. 2003), as atmospheric nitrogen overwhelms ecosystem retention capacity.
Another reason that the Corn Belt contributes so much nitrogen to the Gulf is that many of the highest fertilizer-input areas in the Midwest occupy land that is normally too wet to farm. To make land arable, farmers install tile drains, buried perforated pipes that convey soil water quickly away from the field and into drainage ditches. Nitrate-nitrogen concentrations in tile-drained water can be high, exceeding 40-50 ppm (the drinking water standard is 10 ppm nitrogen as nitrate). For example, about 35 percent of Illinois' agricultural lands are tile-drained (USDA 1987, cited in David et al 1997), greatly increasing fertilizer runoff from these areas.
Finally, the high fertilizer-input, tile drained areas already implicated for fertilizer runoff are also located relatively near large, main stem rivers of the MRB, so there is less opportunity for in-stream denitrification of nitrate, once it reaches a river (Alexander et al. 2000a, Goolsby et al. 2001). Denitrification is a bacterially mediated process which converts biologically available nitrate to gaseous forms, where it is no longer available to fuel algal growth. In aquatic systems, denitrification occurs chiefly in sediments, thus denitrification losses are higher in small, slow-moving streams with a high ratio of sediment to water contact than in large main stem rivers with a high velocity and high volume. Increasing time-of-travel for source waters to the Gulf also increases the probability of denitrification (Alexander et al. 2000a).
Nitrate flux is highest where subsidy payments are highest
Total commodity support payments to farms in the MRB were $59.7 billion between 1995 and 2002, while conservation payments were $8.5 billion. The 124 counties that comprised the 5 percent of the MRB with the highest rates of spring fertilizer runoff received 17 percent of commodity support payments allocated in the MRB, but only 8 percent of the conservation subsidies. A key feature of these commodity subsidies is that they pay farmers to grow only a few different crops, primarily corn, wheat, cotton, and soybeans. A full 45 percent of commodity payments go to corn, which typically requires the highest fertilizer inputs of any major crop. Hence it is not surprising that the map of spring nitrate flux resembles the map of commodity payments very closely, since areas that receive corn subsidies constitute the most significant sources of spring nitrate pollution.
Almost $400 million worth of fertilizer flushes into the Gulf every spring
Fertilizer runoff to the Gulf costs farmers an average of $270,000,000 each spring. These figures take into consideration the actual types, prices, and amounts of fertilizers used in each year between 1998 and 2002. Since 2002, the last year for which we calibrated our model, fertilizer prices have risen considerably due to the energy costs of production. Applying current fertilizer prices to the amounts of fertilizer flushed into the Gulf for the modeled years of 2001-2002 shows just how much fertilizer runoff is currently costing farmers: an average of $391,000,000 per spring runoff period. The figure for yearly losses is even greater, since for the limited number of sites where we had year-round data, year-round nitrate flux was about 1.7 times greater than spring runoff. However, it is important to note that because nonpoint pollution is coupled to runoff, the relative importance of fertilizer as a source of nitrate changes over the course of the year, making it difficult to attach an exact dollar figure to the cost of fertilizer runoff year-round.
Between 1995 and 2002, total commodity payments to farmers in the MRB were $59.7 billion, while total conservation subsidies were $8.5 billion. However, commodity subsidies can increase dramatically in certain years, while conservation spending has remained flat. For the peak years of 1999-2000, commodity subsidies in the MRB averaged $13.28 billion a year, a 260 percent increase over the previous three years, while conservation subsidies averaged just $1.21 billion a year, essentially unchanged from the previous period.
Far more farmers want to participate in conservation programs than can currently be accommodated. The Wetlands Reserve Program (WRP) funds long-term protection and restoration of wetlands by land owners. In 2004, farmers in three states that are the source of much of the nitrate to the Gulf — Illinois, Iowa, and Indiana — applied for about $124 million more in assistance than was granted under this program (all data on unfunded applications are from USDA's Natural Resource Conservation Service website). The Environmental Quality Incentives Program (EQIP), which helps farmers pay for conservation practices on working lands, was underfunded by about $235 million in those same three states. The Gulf hypoxia assessment estimates that 5-13 million acres of wetlands will need to be restored in the MRB to effectively reduce nitrogen loading to the Gulf (Mitsch et al. 1999, 2001), compared with current acreages, which are considerably lower. For example, there are about 1.85 million acres of land supported under the "wetland practices" component of the Conservation Reserve Program in the major states of the MRB (FSA 2004), but the majority of these (84 percent) are in the states of Minnesota, North Dakota, and South Dakota, none of which contribute significantly to nutrient pollution entering the Gulf.
While restoring wetlands and bottomland forests to the levels needed to improve water quality will represent a significant commitment, the many benefits will outweigh the costs even in the medium term. Besides helping to remove nutrients and other contaminants from water, wetlands provide significant flood-control benefits (Hey and Philippi 1995), the value of which cannot be overestimated under scenarios of increasing precipitation in the MRB (Lins and Slack 2005) and the known property costs of previous floods. Wetlands and restored riparian forests would also provide habitat and miles of connected corridors for wildlife, fish, and migrating birds, as well as the intangible aesthetic benefits of a diversified and living landscape. Farmers and land owners appreciate these values as much as anyone, as shown by the tremendous (and presently unmet) demand for funding to assist in conservation and restoration efforts.
Our findings in the context of USGS data and other models
Our modeled estimates for spring nitrate flux to the Gulf are well correlated with USGS measured values. For the years 1990 to 2002, our estimate averaged 84 percent of the measured flux for the months of March-June (R2 = 0.60) and 90 percent of measured flux for the April-July period (R2 = 0.85). The model estimates nitrate loading to rivers in the MRB for the months of March-June, but that water actually arrives at the Gulf weeks later, which probably explains the tighter relationship between our flux estimates and flux measured just above the Gulf in the April-July period. Additionally, inputs to our model consist of the current year's nitrogen inputs to the MRB, thus the model is likely to underestimate the response of nitrate flux to runoff events that mobilize nitrogen stored in soils and groundwater (Goolsby and Battaglin 2001, McIsaac et al. 2001, Scavia et al. 2004, Turner et al. 2006).
Evaluating our findings in the context of other nitrogen loading models for the Gulf also suggests that our results are robust. Because our model characterizes nitrate flux in the spring, while other models tend to characterize either total nitrogen or nitrate on a year-round basis, direct comparisons are difficult. Nonetheless, the basic conclusions are qualitatively similar. The USGS SPARROW model, which describes annual total nitrogen flux to the Gulf in the late 1980s (Smith et al. 1997, Alexander et al. 2000a), calculates total N flux at about 13.4 million pounds a day, with the largest proportion — 49 percent — coming from fertilizer runoff. A further 18 percent comes from atmospheric deposition, 14 percent from livestock wastes, 6 percent from point sources, and 13 percent from nonagricultural sources, such as forest soils. Just 24 percent of the land area accounts for 71 percent of the total N flux.
The model of McIsaac et al. (2001, 2002) accounts for 95 percent of the variation in yearly nitrate flux to the Gulf for the years 1960-1998, the period over which fertilizer use and nitrate loading increased dramatically (Goolsby et al. 2001). Their model takes into account not only nitrogen inputs to the MRB in the current year, but finds a significant effect of "residual" nitrogen from previous years, which is particularly susceptible to loss when precipitation and runoff are high. They note an apparent threshold for net anthropogenic inputs at which nitrate flux to aquatic systems becomes abruptly worse, similar to our observations, and conclude that a 14 percent reduction in fertilizer inputs in the past could have achieved a 33 percent reduction in aquatic nitrate loading to the Gulf (McIsaac et al. 2002).
Other models of N loading in the MRB have also suggested the importance of a threshold beyond which the terrestrial and aquatic systems can no longer retain nitrogen inputs. Donner and Kucharik (2003) note that modeled nitrate flux increases sharply once fertilizer inputs exceed amounts that crops can use, a situation which is common in cropping systems where farmers over fertilize as a form of "insurance". Goolsby and Battaglin (2001) used the proportion of land area under crops as an input to one version of their nitrogen loading model, noting an apparent threshold for total nitrogen flux as cropped area increases.
Nitrate flux is related to the specific crops grown, since cropping patterns largely determine fertilizer use. Donner (2003) found as cropland cover increases, total nitrogen flux also increases, and that nitrate comprises a greater proportion of total nitrogen when corn is a major crop. Three primary crops — corn, soybean, and wheat — were estimated to account for 86 percent of nitrate leaching for the 1990-1994 period, despite accounting for less than 20 percent of land area in the MRB (Donner et al. 2004). Importantly, the influence of soybean was found to be ambiguous. As a nitrogen-fixer, soybean requires less fertilizer inputs than other crops, and studies indicate that it uses residual nitrogen in soil (David et al. 1997, Donner et al. 2004), suggesting it should therefore contribute little to nutrient leaching from soils. However, because it is typically grown in rotation with corn, it is difficult to separate the "signal" of corn and soybean when nitrate flux is evaluated in the context of crop cover (Donner et al. 2004). Our analysis, which expresses all crops strictly on the basis of fertilizer inputs (by multiplying acres grown by fertilizer application rate), avoids this problem.
Recommendations
Increase funding to conservation programs in the MRB
There are two main approaches to reducing N loading to streams: reduce the amount of fertilizer applied at the watershed level; and manage the landscape to more effectively absorb and denitrify the fertilizer that does run off fields. Our analysis, as well as other similar models (Goolsby and Battaglin 2001), indicates that for watersheds where the proportion of land area under fertilized agriculture exceeds a certain threshold, there is an abrupt increase in the amount of fertilizer that runs off into streams and rivers, but in watersheds below that threshold, nitrogen export in rivers is much less. In the watersheds that produce the most fertilizer runoff, the proportion of land in any kind of conservation program tends to decline as the proportion of land in fertilized agriculture increases - just the opposite of what is needed to intercept and denitrify fertilizer runoff. Our analysis suggests that because fertilizer runoff increases abruptly once fertilizer use passes a certain threshold, the amount of land in conservation also needs to increase in a non-linear fashion to "keep up" with runoff. Even in the most heavily fertilized areas of the MRB, diversifying land use to increase the proportion of land in conservation or low-intensity uses like pasture can dramatically improve water quality. Most effective will be the restoration of natural streamside vegetation and wetlands, which intercept nitrogen runoff and facilitate denitrification.
The Conservation Reserve Program (CRP) is by far the biggest federal conservation program for agriculture. The majority of Conservation Reserve acres in the MRB are in the western part of the basin, which is in any case not a major source of nitrogen loading to the Gulf. The CRP was originally conceived as a means to take highly erodable land out production, and has been successful where it was deployed, but its original intent was to preserve soils, not protect surface waters against nitrogen loading. Adequately funding conservation incentive programs that support farmers' efforts to reduce runoff pollution on working lands would not only improve water quality, but also allow a broader sector of the farming community to enjoy the benefits of subsidy payments. Programs already on the books, such as the Environmental Quality Incentives Program (EQIP), have major backlogs of unfunded applications, showing that farmers stand ready to do their part. Ultimately, funding such programs will represent a net savings, given in the improvements in local and regional water quality that could result. The large amounts of commodity support dollars allocated in the known hotspots of agricultural nitrate pollution is money already being spent. In some cases, it supports dramatic overproduction, as was the case in 2004 and 2005 when farmers lost millions of bushels of corn to spoilage because they could not find tarps big enough to cover the piles (Barrionuevo 2005). Redirecting some of these dollars to conservation and riparian restoration would involve little if any additional expense.
Require nutrient management plans as a condition for receiving subsidies
There is a plethora of data to show that farmers who follow best mangagement practices — testing soils for nitrate before applying fertilizer, timing applications to track crop needs — use less nitrogen than those who don't. Recent data from USDA (Kim and Quinby 2004) demonstrates a reduction of 4 percent in the amount of fertilizer applied when farmers pre-test soils, but that only 17 percent of soils are tested. Excess fertilizer entering aquatic systems has a detrimental effect in the environment no less than a toxic substance would. Farmers should be required to submit a nutrient management plan, showing that they plan to use fertilizer responsibly, as a condition for receiving taxpayer subsidies.
Restore funding to government agencies responsible for monitoring water quality
Cuts in funding at the USGS, the source of most water data used in models of the MRB, have meant that long-term monitoring at many sites has ceased. Data are no longer collected at many of the flagship monitoring sites that were used in the federal Gulf Hypoxia Assessment's nitrogen loading model (Goolsby et al. 1999), the results of which have been used to formulate the "Action Plan" for Gulf remediation. The National Research Council's recent report on the state and prospects of water-related research in the nation sounds an alarm that the US is dramatically under prepared for the water quality issues we face in the near future (NRC 2004). Water quality is declining in both populated and unpopulated areas throughout the nation due to ever-increasing agricultural pollution, industry, population growth, logging, mining and suburban sprawl, thus restoring funding to the federal agencies charged with water quality monitoring is an urgent priority.
County Listings
To Restore Gulf Fisheries, Conservation Money Should Be Targeted to Top Polluting Counties
Five Percent of the MRB Accounts for 40% of the Fertilizer Nitrate Causing the Dead Zone
|
State/County |
Farm subsidies |
Conservation |
Ratio of Farm |
|---|---|---|---|
| Craighead County, Arkansas | $229,278,784 | $460,547 | $498:$1 |
| Crittenden County, Arkansas | $137,971,759 | $126,467 | $1,091:$1 |
| Greene County, Arkansas | $145,045,837 | $792,666 | $183:$1 |
| Mississippi County, Arkansas | $194,942,595 | $309,184 | $631:$1 |
| Poinsett County, Arkansas | $300,554,832 | $628,590 | $478:$1 |
| Saint Francis County, Arkansas | $131,639,141 | $449,319 | $293:$1 |
| Brown County, Illinois | $31,047,400 | $727,875 | $43:$1 |
| Bureau County, Illinois | $180,354,593 | $105,636 | $1,707:$1 |
| Calhoun County, Illinois | $15,549,070 | $4,783 | $3,251:$1 |
| Carroll County, Illinois | $88,198,822 | $8,765 | $10,063:$1 |
| Cass County, Illinois | $55,246,619 | $618,570 | $89:$1 |
| Champaign County, Illinois | $209,448,189 | $95,804 | $2,186:$1 |
| Christian County, Illinois | $142,812,291 | $145,275 | $983:$1 |
| Clark County, Illinois | $68,099,111 | $47,972 | $1,420:$1 |
| Clay County, Illinois | $52,966,201 | $18,122 | $2,923:$1 |
| Coles County, Illinois | $84,970,525 | $398,505 | $213:$1 |
| Crawford County, Illinois | $55,165,902 | $120,214 | $459:$1 |
| Cumberland County, Illinois | $47,666,263 | $434,927 | $110:$1 |
| De Witt County, Illinois | $74,506,355 | $60,331 | $1,235:$1 |
| Douglas County, Illinois | $93,613,478 | $186,080 | $503:$1 |
| Edgar County, Illinois | $115,382,944 | $164,966 | $699:$1 |
| Edwards County, Illinois | $24,161,110 | $25,136 | $961:$1 |
| Effingham County, Illinois | $58,939,547 | $90,708 | $650:$1 |
| Ford County, Illinois | $95,415,067 | $22,785 | $4,188:$1 |
| Fulton County, Illinois | $86,369,830 | $77,976 | $1,108:$1 |
| Greene County, Illinois | $67,751,531 | $110,288 | $614:$1 |
| Grundy County, Illinois | $76,750,245 | $0 | $0:$1 |
| Hancock County, Illinois | $106,762,458 | $96,827 | $1,103:$1 |
| Henderson County, Illinois | $69,070,527 | $146,882 | $470:$1 |
| Henry County, Illinois | $173,408,749 | $9,828 | $17,644:$1 |
| Iroquois County, Illinois | $221,950,425 | $581,221 | $382:$1 |
| Jasper County, Illinois | $67,601,563 | $149,674 | $452:$1 |
| Jersey County, Illinois | $43,518,780 | $90,718 | $480:$1 |
| Kane County, Illinois | $66,357,782 | $42,550 | $1,560:$1 |
| Kendall County, Illinois | $59,340,921 | $17,551 | $3,381:$1 |
| Knox County, Illinois | $119,297,372 | $121,061 | $985:$1 |
| La Salle County, Illinois | $202,087,302 | $107,730 | $1,876:$1 |
| Lawrence County, Illinois | $52,472,911 | $282,540 | $186:$1 |
| Lee County, Illinois | $150,807,543 | $31,026 | $4,861:$1 |
| Livingston County, Illinois | $211,983,807 | $97,537 | $2,173:$1 |
| Logan County, Illinois | $137,053,648 | $4,816 | $28,458:$1 |
| McDonough County, Illinois | $98,246,415 | $148,195 | $663:$1 |
| McLean County, Illinois | $249,156,190 | $302,298 | $824:$1 |
| Macon County, Illinois | $112,229,355 | $79,679 | $1,409:$1 |
| Marshall County, Illinois | $68,953,421 | $76,500 | $901:$1 |
| Mason County, Illinois | $73,484,102 | $11,286 | $6,511:$1 |
| Menard County, Illinois | $59,186,731 | $105,344 | $562:$1 |
| Mercer County, Illinois | $99,118,249 | $50,314 | $1,970:$1 |
| Morgan County, Illinois | $100,039,915 | $596,359 | $168:$1 |
| Ogle County, Illinois | $137,056,519 | $19,926 | $6,878:$1 |
| Piatt County, Illinois | $100,738,534 | $32,945 | $3,058:$1 |
| Putnam County, Illinois | $25,402,051 | $6,345 | $4,003:$1 |
| Richland County, Illinois | $53,345,393 | $236,404 | $226:$1 |
| Rock Island County, Illinois | $50,642,754 | $55,929 | $905:$1 |
| Sangamon County, Illinois | $146,927,627 | $38,010 | $3,865:$1 |
| Schuyler County, Illinois | $41,378,057 | $663,719 | $62:$1 |
| Scott County, Illinois | $36,003,899 | $136,545 | $264:$1 |
| Stark County, Illinois | $71,801,213 | $3,396 | $21,143:$1 |
| Tazewell County, Illinois | $111,723,615 | $279,685 | $399:$1 |
| Vermilion County, Illinois | $157,601,299 | $564,231 | $279:$1 |
| Wabash County, Illinois | $35,853,180 | $365,043 | $98:$1 |
| Warren County, Illinois | $119,168,532 | $23,162 | $5,145:$1 |
| White County, Illinois | $64,292,471 | $24,715 | $2,601:$1 |
| Whiteside County, Illinois | $134,557,585 | $810,163 | $166:$1 |
| Winnebago County, Illinois | $64,264,171 | $21,230 | $3,027:$1 |
| Woodford County, Illinois | $104,311,281 | $170,201 | $613:$1 |
| Benton County, Indiana | $84,281,727 | $148,179 | $569:$1 |
| Boone County, Indiana | $71,801,911 | $255,389 | $281:$1 |
| Clay County, Indiana | $40,963,177 | $96,642 | $424:$1 |
| Clinton County, Indiana | $75,953,576 | $51,941 | $1,462:$1 |
| Fountain County, Indiana | $68,768,791 | $76,441 | $900:$1 |
| Fulton County, Indiana | $52,559,803 | $4,074 | $12,901:$1 |
| Gibson County, Indiana | $74,301,686 | $166,930 | $445:$1 |
| Howard County, Indiana | $50,175,360 | $87,707 | $572:$1 |
| Jasper County, Indiana | $92,195,726 | $11,535 | $7,993:$1 |
| Knox County, Indiana | $91,736,107 | $181,515 | $505:$1 |
| Kosciusko County, Indiana | $58,554,542 | $197,996 | $296:$1 |
| Montgomery County, Indiana | $81,265,604 | $129,138 | $629:$1 |
| Newton County, Indiana | $77,149,597 | $1,566 | $49,265:$1 |
| Parke County, Indiana | $46,986,799 | $86,554 | $543:$1 |
| Posey County, Indiana | $64,774,830 | $53,446 | $1,212:$1 |
| Pulaski County, Indiana | $66,272,397 | $68,107 | $973:$1 |
| Sullivan County, Indiana | $47,877,988 | $336,086 | $142:$1 |
| Tippecanoe County, Indiana | $72,397,191 | $52,447 | $1,380:$1 |
| Tipton County, Indiana | $51,675,663 | $33,474 | $1,544:$1 |
| Vanderburgh County, Indiana | $28,461,190 | $107,347 | $265:$1 |
| Vermillion County, Indiana | $16,792,506 | $14,010 | $1,199:$1 |
| Vigo County, Indiana | $33,728,500 | $105,687 | $319:$1 |
| Warren County, Indiana | $62,362,364 | $15,746 | $3,960:$1 |
| White County, Indiana | $89,726,729 | $32,142 | $2,792:$1 |
| Benton County, Iowa | $133,541,756 | $116,733 | $1,144:$1 |
| Black Hawk County, Iowa | $103,948,298 | $113,420 | $916:$1 |
| Bremer County, Iowa | $88,594,385 | $108,943 | $813:$1 |
| Buchanan County, Iowa | $119,253,991 | $41,758 | $2,856:$1 |
| Cedar County, Iowa | $124,909,317 | $163,154 | $766:$1 |
| Chickasaw County, Iowa | $93,162,476 | $173,649 | $536:$1 |
| Clayton County, Iowa | $93,682,529 | $298,634 | $314:$1 |
| Clinton County, Iowa | $137,955,188 | $228,760 | $603:$1 |
| Delaware County, Iowa | $125,476,652 | $96,087 | $1,306:$1 |
| Des Moines County, Iowa | $57,187,135 | $134,072 | $427:$1 |
| Dubuque County, Iowa | $80,899,703 | $24,847 | $3,256:$1 |
| Fayette County, Iowa | $137,165,674 | $245,239 | $559:$1 |
| Grundy County, Iowa | $118,962,129 | $69,395 | $1,714:$1 |
| Henry County, Iowa | $66,113,418 | $82,660 | $800:$1 |
| Howard County, Iowa | $76,663,659 | $142,906 | $536:$1 |
| Iowa County, Iowa | $81,976,049 | $529,965 | $155:$1 |
| Jackson County, Iowa | $64,494,039 | $138,586 | $465:$1 |
| Jefferson County, Iowa | $46,540,277 | $659,916 | $71:$1 |
| Johnson County, Iowa | $78,158,279 | $135,161 | $578:$1 |
| Jones County, Iowa | $103,672,229 | $313,929 | $330:$1 |
| Lee County, Iowa | $51,732,672 | $170,785 | $303:$1 |
| Linn County, Iowa | $101,397,757 | $149,928 | $676:$1 |
| Louisa County, Iowa | $61,316,482 | $198,883 | $308:$1 |
| Muscatine County, Iowa | $68,686,042 | $115,194 | $596:$1 |
| Scott County, Iowa | $88,894,422 | $23,777 | $3,739:$1 |
| Washington County, Iowa | $92,898,592 | $1,300,746 | $71:$1 |
| Henderson County, Kentucky | $48,126,303 | $604,411 | $80:$1 |
| Union County, Kentucky | $48,645,301 | $11,898 | $4,089:$1 |
| Dunklin County, Missouri | $106,555,773 | $612,611 | $174:$1 |
| Mississippi County, Missouri | $77,803,375 | $98,517 | $790:$1 |
| New Madrid County, Missouri | $180,120,510 | $207,488 | $868:$1 |
| Pemiscot County, Missouri | $108,362,335 | $43,899 | $2,468:$1 |
| Scott County, Missouri | $61,145,762 | $372,150 | $164:$1 |
| Stoddard County, Missouri | $224,228,698 | $368,882 | $608:$1 |
| Total | $11,614,079,358 | $23,244,158 | $500:$1 |
* Includes payments for the Environmental Quality Incentives Program, the Wetlands Reserve Program, and all payments in the Conservation Reserve Program if the producer received a CRP - Wetlands or CRP - Riparian Area contract payment.
15 Percent of the MRB Accounts for 78% of the Fertilizer Nitrate Causing the Dead Zone
| State/County | Farm subsidies 1995-2002 |
Conservation Payments* 1995-2002 |
Ratio of Farm payments to Conservation payments |
|---|---|---|---|
| Arkansas County, Arkansas | $250,154,699 | $577,385 | $433:$1 |
| Clay County, Arkansas | $198,739,145 | $322,456 | $616:$1 |
| Craighead County, Arkansas | $229,278,784 | $460,547 | $498:$1 |
| Crittenden County, Arkansas | $137,971,759 | $126,467 | $1,091:$1 |
| Cross County, Arkansas | $224,455,788 | $237,675 | $944:$1 |
| Greene County, Arkansas | $145,045,837 | $792,666 | $183:$1 |
| Jackson County, Arkansas | $197,962,709 | $65,264 | $3,033:$1 |
| Lee County, Arkansas | $129,561,155 | $584,793 | $222:$1 |
| Lonoke County, Arkansas | $203,469,740 | $587,439 | $346:$1 |
| Mississippi County, Arkansas | $194,942,595 | $309,184 | $631:$1 |
| Monroe County, Arkansas | $131,095,733 | $125,462 | $1,045:$1 |
| Phillips County, Arkansas | $155,140,076 | $380,722 | $407:$1 |
| Poinsett County, Arkansas | $300,554,832 | $628,590 | $478:$1 |
| Saint Francis County, Arkansas | $131,639,141 | $449,319 | $293:$1 |
| Woodruff County, Arkansas | $148,166,912 | $686,861 | $216:$1 |
| Adams County, Illinois | $82,277,825 | $89,982 | $914:$1 |
| Bond County, Illinois | $44,741,931 | $112,192 | $399:$1 |
| Boone County, Illinois | $50,162,288 | $9,386 | $5,344:$1 |
| Brown County, Illinois | $31,047,400 | $727,875 | $43:$1 |
| Bureau County, Illinois | $180,354,593 | $105,636 | $1,707:$1 |
| Calhoun County, Illinois | $15,549,070 | $4,783 | $3,251:$1 |
| Carroll County, Illinois | $88,198,822 | $8,765 | $10,063:$1 |
| Cass County, Illinois | $55,246,619 | $618,570 | $89:$1 |
| Champaign County, Illinois | $209,448,189 | $95,804 | $2,186:$1 |
| Christian County, Illinois | $142,812,291 | $145,275 | $983:$1 |
| Clark County, Illinois | $68,099,111 | $47,972 | $1,420:$1 |
| Clay County, Illinois | $52,966,201 | $18,122 | $2,923:$1 |
| Clinton County, Illinois | $63,810,626 | $272,434 | $234:$1 |
| Coles County, Illinois | $84,970,525 | $398,505 | $213:$1 |
| Crawford County, Illinois | $55,165,902 | $120,214 | $459:$1 |
| Cumberland County, Illinois | $47,666,263 | $434,927 | $110:$1 |
| DeKalb County, Illinois | $142,879,153 | $192,275 | $743:$1 |
| De Witt County, Illinois | $74,506,355 | $60,331 | $1,235:$1 |
| Douglas County, Illinois | $93,613,478 | $186,080 | $503:$1 |
| Edgar County, Illinois | $115,382,944 | $164,966 | $699:$1 |
| Edwards County, Illinois | $24,161,110 | $25,136 | $961:$1 |
| Effingham County, Illinois | $58,939,547 | $90,708 | $650:$1 |
| Fayette County, Illinois | $71,677,323 | $145,996 | $491:$1 |
| Ford County, Illinois | $95,415,067 | $22,785 | $4,188:$1 |
| Fulton County, Illinois | $86,369,830 | $77,976 | $1,108:$1 |
| Gallatin County, Illinois | $52,575,038 | $27,221 | $1,931:$1 |
| Greene County, Illinois | $67,751,531 | $110,288 | $614:$1 |
| Grundy County, Illinois | $76,750,245 | $0 | $0:$1 |
| Hamilton County, Illinois | $45,693,798 | $91,183 | $501:$1 |
| Hancock County, Illinois | $106,762,458 | $96,827 | $1,103:$1 |
| Henderson County, Illinois | $69,070,527 | $146,882 | $470:$1 |
| Henry County, Illinois | $173,408,749 | $9,828 | $17,644:$1 |
| Iroquois County, Illinois | $221,950,425 | $581,221 | $382:$1 |
| Jasper County, Illinois | $67,601,563 | $149,674 | $452:$1 |
| Jersey County, Illinois | $43,518,780 | $90,718 | $480:$1 |
| Jo Daviess County, Illinois | $55,774,069 | $24,534 | $2,273:$1 |
| Kane County, Illinois | $66,357,782 | $42,550 | $1,560:$1 |
| Kankakee County, Illinois | $124,227,481 | $161,508 | $769:$1 |
| Kendall County, Illinois | $59,340,921 | $17,551 | $3,381:$1 |
| Knox County, Illinois | $119,297,372 | $121,061 | $985:$1 |
| La Salle County, Illinois | $202,087,302 | $107,730 | $1,876:$1 |
| Lawrence County, Illinois | $52,472,911 | $282,540 | $186:$1 |
| Lee County, Illinois | $150,807,543 | $31,026 | $4,861:$1 |
| Livingston County, Illinois | $211,983,807 | $97,537 | $2,173:$1 |
| Logan County, Illinois | $137,053,648 | $4,816 | $28,458:$1 |
| McDonough County, Illinois | $98,246,415 | $148,195 | $663:$1 |
| McHenry County, Illinois | $64,476,371 | $4,184 | $15,410:$1 |
| McLean County, Illinois | $249,156,190 | $302,298 | $824:$1 |
| Macon County, Illinois | $112,229,355 | $79,679 | $1,409:$1 |
| Macoupin County, Illinois | $110,258,767 | $299,534 | $368:$1 |
| Madison County, Illinois | $72,338,514 | $34,509 | $2,096:$1 |
| Marion County, Illinois | $50,166,992 | $178,069 | $282:$1 |
| Marshall County, Illinois | $68,953,421 | $76,500 | $901:$1 |
| Mason County, Illinois | $73,484,102 | $11,286 | $6,511:$1 |
| Menard County, Illinois | $59,186,731 | $105,344 | $562:$1 |
| Mercer County, Illinois | $99,118,249 | $50,314 | $1,970:$1 |
| Montgomery County, Illinois | $104,292,101 | $631,128 | $165:$1 |
| Morgan County, Illinois | $100,039,915 | $596,359 | $168:$1 |
| Moultrie County, Illinois | $66,928,027 | $30,558 | $2,190:$1 |
| Ogle County, Illinois | $137,056,519 | $19,926 | $6,878:$1 |
| Peoria County, Illinois | $74,156,762 | $23,913 | $3,101:$1 |
| Piatt County, Illinois | $100,738,534 | $32,945 | $3,058:$1 |
| Pike County, Illinois | $81,461,969 | $277,747 | $293:$1 |
| Putnam County, Illinois | $25,402,051 | $6,345 | $4,003:$1 |
| Randolph County, Illinois | $46,799,257 | $285,003 | $164:$1 |
| Richland County, Illinois | $53,345,393 | $236,404 | $226:$1 |
| Rock Island County, Illinois | $50,642,754 | $55,929 | $905:$1 |
| Saint Clair County, Illinois | $67,347,268 | $132,020 | $510:$1 |
| Saline County, Illinois | $29,107,829 | $30,927 | $941:$1 |
| Sangamon County, Illinois | $146,927,627 | $38,010 | $3,865:$1 |
| Schuyler County, Illinois | $41,378,057 | $663,719 | $62:$1 |
| Scott County, Illinois | $36,003,899 | $136,545 | $264:$1 |
| Shelby County, Illinois | $116,993,273 | $103,054 | $1,135:$1 |
| Stark County, Illinois | $71,801,213 | $3,396 | $21,143:$1 |
| Stephenson County, Illinois | $97,377,374 | $15,581 | $6,250:$1 |
| Tazewell County, Illinois | $111,723,615 | $279,685 | $399:$1 |
| Vermilion County, Illinois | $157,601,299 | $564,231 | $279:$1 |
| Wabash County, Illinois | $35,853,180 | $365,043 | $98:$1 |
| Warren County, Illinois | $119,168,532 | $23,162 | $5,145:$1 |
| Washington County, Illinois | $74,903,606 | $217,525 | $344:$1 |
| Wayne County, Illinois | $63,096,632 | $18,913 | $3,336:$1 |
| White County, Illinois | $64,292,471 | $24,715 | $2,601:$1 |
| Whiteside County, Illinois | $134,557,585 | $810,163 | $166:$1 |
| Will County, Illinois | $79,789,616 | $0 | $0:$1 |
| Winnebago County, Illinois | $64,264,171 | $21,230 | $3,027:$1 |
| Woodford County, Illinois | $104,311,281 | $170,201 | $613:$1 |
| Benton County, Indiana | $84,281,727 | $148,179 | $569:$1 |
| Blackford County, Indiana | $17,180,210 | $41,180 | $417:$1 |
| Boone County, Indiana | $71,801,911 | $255,389 | $281:$1 |
| Carroll County, Indiana | $71,976,992 | $138,246 | $521:$1 |
| Cass County, Indiana | $63,111,362 | $253,678 | $249:$1 |
| Clinton County, Indiana | $75,953,576 | $51,941 | $1,462:$1 |
| Daviess County, Indiana | $57,145,293 | $193,812 | $295:$1 |
| Decatur County, Indiana | $63,600,451 | $120,751 | $527:$1 |
| Delaware County, Indiana | $50,942,577 | $180,000 | $283:$1 |
| Dubois County, Indiana | $44,483,170 | $430,964 | $103:$1 |
| Fayette County, Indiana | $27,031,996 | $85,782 | $315:$1 |
| Fountain County, Indiana | $68,768,791 | $76,441 | $900:$1 |
| Franklin County, Indiana | $25,208,199 | $15,166 | $1,662:$1 |
| Fulton County, Indiana | $52,559,803 | $4,074 | $12,901:$1 |
| Gibson County, Indiana | $74,301,686 | $166,930 | $445:$1 |
| Grant County, Indiana | $55,520,822 | $35,499 | $1,564:$1 |
| Greene County, Indiana | $27,052,850 | $81,321 | $333:$1 |
| Hamilton County, Indiana | $39,639,641 | $0 | $0:$1 |
| Hancock County, Indiana | $49,337,963 | $27,605 | $1,787:$1 |
| Hendricks County, Indiana | $44,933,788 | $22,246 | $2,020:$1 |
| Henry County, Indiana | $51,682,771 | $32,251 | $1,603:$1 |
| Howard County, Indiana | $50,175,360 | $87,707 | $572:$1 |
| Huntington County, Indiana | $49,520,116 | $12,086 | $4,097:$1 |
| Jasper County, Indiana | $92,195,726 | $11,535 | $7,993:$1 |
| Jay County, Indiana | $50,679,245 | $97,034 | $522:$1 |
| Johnson County, Indiana | $38,198,481 | $20,128 | $1,898:$1 |
| Knox County, Indiana | $91,736,107 | $181,515 | $505:$1 |
| Kosciusko County, Indiana | $58,554,542 | $197,996 | $296:$1 |
| La Porte County, Indiana | $72,652,043 | $60,013 | $1,211:$1 |
| Madison County, Indiana | $63,409,948 | $21,223 | $2,988:$1 |
| Marion County, Indiana | $5,910,518 | $0 | $0:$1 |
| Marshall County, Indiana | $51,738,379 | $33,950 | $1,524:$1 |
| Miami County, Indiana | $49,410,483 | $361,221 | $137:$1 |
| Montgomery County, Indiana | $81,265,604 | $129,138 | $629:$1 |
| Morgan County, Indiana | $31,702,386 | $19,200 | $1,651:$1 |
| Newton County, Indiana | $77,149,597 | $1,566 | $49,265:$1 |
| Owen County, Indiana | $11,592,363 | $101,664 | $114:$1 |
| Parke County, Indiana | $46,986,799 | $86,554 | $543:$1 |
| Perry County, Indiana | $6,406,155 | $94,837 | $68:$1 |
| Pike County, Indiana | $22,351,403 | $61,008 | $366:$1 |
| Porter County, Indiana | $41,321,154 | $205,213 | $201:$1 |
| Posey County, Indiana | $64,774,830 | $53,446 | $1,212:$1 |
| Pulaski County, Indiana | $66,272,397 | $68,107 | $973:$1 |
| Randolph County, Indiana | $55,195,310 | $69,931 | $789:$1 |
| Rush County, Indiana | $76,924,038 | $98,472 | $781:$1 |
| Saint Joseph County, Indiana | $42,236,718 | $47,775 | $884:$1 |
| Shelby County, Indiana | $67,572,475 | $51,461 | $1,313:$1 |
| Spencer County, Indiana | $36,892,514 | $126,836 | $291:$1 |
| Starke County, Indiana | $34,965,482 | $151,247 | $231:$1 |
| Sullivan County, Indiana | $47,877,988 | $336,086 | $142:$1 |
| Tippecanoe County, Indiana | $72,397,191 | $52,447 | $1,380:$1 |
| Tipton County, Indiana | $51,675,663 | $33,474 | $1,544:$1 |
| Union County, Indiana | $25,174,443 | $27,827 | $905:$1 |
| Vanderburgh County, Indiana | $28,461,190 | $107,347 | $265:$1 |
| Vermillion County, Indiana | $16,792,506 | $14,010 | $1,199:$1 |
| Vigo County, Indiana | $33,728,500 | $105,687 | $319:$1 |
| Wabash County, Indiana | $48,890,509 | $95,314 | $513:$1 |
| Warren County, Indiana | $62,362,364 | $15,746 | $3,960:$1 |
| Warrick County, Indiana | $26,437,132 | $111,402 | $237:$1 |
| Wayne County, Indiana | $45,608,281 | $131,362 | $347:$1 |
| Wells County, Indiana | $56,616,691 | $19,857 | $2,851:$1 |
| White County, Indiana | $89,726,729 | $32,142 | $2,792:$1 |
| Whitley County, Indiana | $37,662,460 | $194,523 | $194:$1 |
| Adams County, Iowa | $40,312,047 | $143,802 | $280:$1 |
| Allamakee County, Iowa | $50,315,478 | $427,668 | $118:$1 |
| Audubon County, Iowa | $72,321,910 | $221,118 | $327:$1 |
| Benton County, Iowa | $133,541,756 | $116,733 | $1,144:$1 |
| Black Hawk County, Iowa | $103,948,298 | $113,420 | $916:$1 |
| Boone County, Iowa | $99,776,285 | $264,559 | $377:$1 |
| Bremer County, Iowa | $88,594,385 | $108,943 | $813:$1 |
| Buchanan County, Iowa | $119,253,991 | $41,758 | $2,856:$1 |
| Buena Vista County, Iowa | $116,267,393 | $20,146 | $5,771:$1 |
| Butler County, Iowa | $106,570,357 | $219,801 | $485:$1 |
| Calhoun County, Iowa | $115,859,129 | $54,124 | $2,141:$1 |
| Carroll County, Iowa | $105,681,346 | $88,563 | $1,193:$1 |
| Cass County, Iowa | $81,978,929 | $184,854 | $443:$1 |
| Cedar County, Iowa | $124,909,317 | $163,154 | $766:$1 |
| Cerro Gordo County, Iowa | $121,717,892 | $352,960 | $345:$1 |
| Cherokee County, Iowa | $104,229,507 | $26,989 | $3,862:$1 |
| Chickasaw County, Iowa | $93,162,476 | $173,649 | $536:$1 |
| Clay County, Iowa | $108,026,386 | $152,245 | $710:$1 |
| Clayton County, Iowa | $93,682,529 | $298,634 | $314:$1 |
| Clinton County, Iowa | $137,955,188 | $228,760 | $603:$1 |
| Crawford County, Iowa | $110,189,003 | $38,132 | $2,890:$1 |
| Dallas County, Iowa | $89,890,038 | $23,175 | $3,879:$1 |
| Davis County, Iowa | $27,906,112 | $383,099 | $73:$1 |
| Delaware County, Iowa | $125,476,652 | $96,087 | $1,306:$1 |
| Des Moines County, Iowa | $57,187,135 | $134,072 | $427:$1 |
| Dickinson County, Iowa | $60,802,745 | $242,647 | $251:$1 |
| Dubuque County, Iowa | $80,899,703 | $24,847 | $3,256:$1 |
| Fayette County, Iowa | $137,165,674 | $245,239 | $559:$1 |
| Floyd County, Iowa | $97,704,908 | $244,354 | $400:$1 |
| Franklin County, Iowa | $127,479,763 | $482,657 | $264:$1 |
| Fremont County, Iowa | $73,401,257 | $428,767 | $171:$1 |
| Greene County, Iowa | $109,346,009 | $93,725 | $1,167:$1 |
| Grundy County, Iowa | $118,962,129 | $69,395 | $1,714:$1 |
| Guthrie County, Iowa | $69,421,851 | $302,479 | $230:$1 |
| Hamilton County, Iowa | $118,764,220 | $20,591 | $5,768:$1 |
| Hancock County, Iowa | $120,023,936 | $59,265 | $2,025:$1 |
| Hardin County, Iowa | $119,595,162 | $251,664 | $475:$1 |
| Harrison County, Iowa | $98,955,569 | $584,665 | $169:$1 |
| Henry County, Iowa | $66,113,418 | $82,660 | $800:$1 |
| Howard County, Iowa | $76,663,659 | $142,906 | $536:$1 |
| Humboldt County, Iowa | $94,731,527 | $375,938 | $252:$1 |
| Ida County, Iowa | $79,968,299 | $30,210 | $2,647:$1 |
| Iowa County, Iowa | $81,976,049 | $529,965 | $155:$1 |
| Jackson County, Iowa | $64,494,039 | $138,586 | $465:$1 |
| Jasper County, Iowa | $116,430,636 | $114,031 | $1,021:$1 |
| Jefferson County, Iowa | $46,540,277 | $659,916 | $71:$1 |
| Johnson County, Iowa | $78,158,279 | $135,161 | $578:$1 |
| Jones County, Iowa | $103,672,229 | $313,929 | $330:$1 |
| Keokuk County, Iowa | $80,052,922 | $232,677 | $344:$1 |
| Kossuth County, Iowa | $216,395,431 | $127,018 | $1,704:$1 |
| Lee County, Iowa | $51,732,672 | $170,785 | $303:$1 |
| Linn County, Iowa | $101,397,757 | $149,928 | $676:$1 |
| Louisa County, Iowa | $61,316,482 | $198,883 | $308:$1 |
| Mahaska County, Iowa | $85,216,417 | $19,806 | $4,303:$1 |
| Marion County, Iowa | $50,669,317 | $107,357 | $472:$1 |
| Marshall County, Iowa | $110,283,780 | $6,124 | $18,008:$1 |
| Mills County, Iowa | $62,641,243 | $99,210 | $631:$1 |
| Mitchell County, Iowa | $92,054,540 | $163,806 | $562:$1 |
| Monona County, Iowa | $100,873,680 | $74,197 | $1,360:$1 |
| Monroe County, Iowa | $19,511,681 | $121,906 | $160:$1 |
| Montgomery County, Iowa | $58,072,461 | $199,793 | $291:$1 |
| Muscatine County, Iowa | $68,686,042 | $115,194 | $596:$1 |
| O'Brien County, Iowa | $120,142,401 | $99,324 | $1,210:$1 |
| Osceola County, Iowa | $81,313,189 | $20,496 | $3,967:$1 |
| Page County, Iowa | $61,648,852 | $760,230 | $81:$1 |
| Plymouth County, Iowa | $137,978,865 | $312,027 | $442:$1 |
| Pocahontas County, Iowa | $123,264,728 | $44,605 | $2,763:$1 |
| Polk County, Iowa | $65,251,385 | $138,407 | $471:$1 |
| Pottawattamie County, Iowa | $153,658,613 | $433,647 | $354:$1 |
| Poweshiek County, Iowa | $87,642,263 | $56,964 | $1,539:$1 |
| Sac County, Iowa | $104,439,106 | $18,074 | $5,778:$1 |
| Scott County, Iowa | $88,894,422 | $23,777 | $3,739:$1 |
| Shelby County, Iowa | $109,074,382 | $39,807 | $2,740:$1 |
| Sioux County, Iowa | $168,748,927 | $229,331 | $736:$1 |
| Story County, Iowa | $112,786,836 | $69,618 | $1,620:$1 |
| Tama County, Iowa | $125,110,770 | $694,684 | $180:$1 |
| Van Buren County, Iowa | $29,380,370 | $205,810 | $143:$1 |
| Wapello County, Iowa | $39,690,407 | $345,162 | $115:$1 |
| Washington County, Iowa | $92,898,592 | $1,300,746 | $71:$1 |
| Webster County, Iowa | $136,442,231 | $37,651 | $3,624:$1 |
| Winnebago County, Iowa | $90,187,291 | $469,473 | $192:$1 |
| Winneshiek County, Iowa | $93,282,966 | $499,206 | $187:$1 |
| Woodbury County, Iowa | $122,340,318 | $248,398 | $493:$1 |
| Worth County, Iowa | $79,487,928 | $317,477 | $250:$1 |
| Wright County, Iowa | $124,894,984 | $491,486 | $254:$1 |
| Brown County, Kansas | $65,833,251 | $278,957 | $236:$1 |
| Doniphan County, Kansas | $44,632,877 | $385,365 | $116:$1 |
| Anderson County, Kentucky | $2,555,094 | $1,505 | $1,698:$1 |
| Ballard County, Kentucky | $20,720,821 | $9,161 | $2,262:$1 |
| Boyle County, Kentucky | $3,783,173 | $18,039 | $210:$1 |
| Caldwell County, Kentucky | $15,017,661 | $105,387 | $143:$1 |
| Carlisle County, Kentucky | $17,236,795 | $3,750 | $4,596:$1 |
| Carroll County, Kentucky | $2,635,824 | $0 | $0:$1 |
| Christian County, Kentucky | $55,526,869 | $476,981 | $116:$1 |
| Daviess County, Kentucky | $49,523,270 | $333,029 | $149:$1 |
| Fayette County, Kentucky | $8,729,334 | $111 | $78,643:$1 |
| Franklin County, Kentucky | $3,329,781 | $20,898 | $159:$1 |
| Fulton County, Kentucky | $22,878,103 | $10,135 | $2,257:$1 |
| Gallatin County, Kentucky | $1,539,411 | $0 | $0:$1 |
| Garrard County, Kentucky | $4,668,771 | $5,381 | $868:$1 |
| Grant County, Kentucky | $3,155,965 | $8,165 | $387:$1 |
| Graves County, Kentucky | $44,903,939 | $365,231 | $123:$1 |
| Hancock County, Kentucky | $6,821,459 | $18,614 | $366:$1 |
| Henderson County, Kentucky | $48,126,303 | $604,411 | $80:$1 |
| Henry County, Kentucky | $8,197,284 | $53,105 | $154:$1 |
| Hickman County, Kentucky | $29,906,627 | $141,409 | $211:$1 |
| Hopkins County, Kentucky | $17,341,722 | $73,143 | $237:$1 |
| Jessamine County, Kentucky | $4,612,330 | $16,295 | $283:$1 |
| Lincoln County, Kentucky | $8,753,582 | $37,821 | $231:$1 |
| Logan County, Kentucky | $48,057,413 | $79,263 | $606:$1 |
| McLean County, Kentucky | $31,769,353 | $0 | $0:$1 |
| Madison County, Kentucky | $7,404,398 | $55,189 | $134:$1 |
| Marion County, Kentucky | $12,331,448 | $129,072 | $96:$1 |
| Mercer County, Kentucky | $6,295,717 | $16,211 | $388:$1 |
| Nelson County, Kentucky | $12,664,878 | $36,145 | $350:$1 |
| Owen County, Kentucky | $4,994,865 | $13,495 | $370:$1 |
| Scott County, Kentucky | $6,871,732 | $3,500 | $1,963:$1 |
| Todd County, Kentucky | $34,901,427 | $370,107 | $94:$1 |
| Union County, Kentucky | $48,645,301 | $11,898 | $4,089:$1 |
| Washington County, Kentucky | $6,720,212 | $24,408 | $275:$1 |
| Webster County, Kentucky | $27,407,116 | $183,571 | $149:$1 |
| Woodford County, Kentucky | $6,883,944 | $69,612 | $99:$1 |
| East Carroll Parish, Louisiana | $100,544,763 | $530,222 | $190:$1 |
| Madison Parish, Louisiana | $86,335,500 | $1,328,687 | $65:$1 |
| Tensas Parish, Louisiana | $114,837,943 | $108,430 | $1,059:$1 |
| Blue Earth County, Minnesota | $130,293,328 | $279,352 | $466:$1 |
| Brown County, Minnesota | $101,116,752 | $28,874 | $3,502:$1 |
| Carver County, Minnesota | $44,194,483 | $239,508 | $185:$1 |
| Cottonwood County, Minnesota | $116,911,153 | $53,404 | $2,189:$1 |
| Dodge County, Minnesota | $79,223,981 | $97,618 | $812:$1 |
| Faribault County, Minnesota | $139,102,803 | $91,181 | $1,526:$1 |
| Fillmore County, Minnesota | $109,782,675 | $370,343 | $296:$1 |
| Freeborn County, Minnesota | $130,608,936 | $633,226 | $206:$1 |
| Goodhue County, Minnesota | $94,909,228 | $426,586 | $222:$1 |
| Houston County, Minnesota | $41,540,556 | $318,350 | $130:$1 |
| Jackson County, Minnesota | $126,427,738 | $3,388 | $37,321:$1 |
| Kandiyohi County, Minnesota | $104,740,097 | $1,410,497 | $74:$1 |
| Le Sueur County, Minnesota | $63,464,423 | $163,917 | $387:$1 |
| Lyon County, Minnesota | $114,468,832 | $780,247 | $147:$1 |
| McLeod County, Minnesota | $68,644,723 | $69,563 | $987:$1 |
| Martin County, Minnesota | $153,495,266 | $108,932 | $1,409:$1 |
| Mower County, Minnesota | $131,858,142 | $481,871 | $274:$1 |
| Nicollet County, Minnesota | $81,735,155 | $197,584 | $414:$1 |
| Olmsted County, Minnesota | $76,965,848 | $718,221 | $107:$1 |
| Pipestone County, Minnesota | $60,436,222 | $172,285 | $351:$1 |
| Redwood County, Minnesota | $153,916,805 | $951,606 | $162:$1 |
| Renville County, Minnesota | $174,678,539 | $309,327 | $565:$1 |
| Rice County, Minnesota | $58,428,388 | $917,248 | $64:$1 |
| Scott County, Minnesota | $28,821,023 | $103,625 | $278:$1 |
| Sibley County, Minnesota | $92,828,725 | $271,235 | $342:$1 |
| Steele County, Minnesota | $78,670,691 | $524,624 | $150:$1 |
| Wabasha County, Minnesota | $53,373,642 | $304,695 | $175:$1 |
| Waseca County, Minnesota | $89,684,551 | $32,692 | $2,743:$1 |
| Watonwan County, Minnesota | $87,833,669 | $72,737 | $1,208:$1 |
| Bolivar County, Mississippi | $257,038,218 | $1,583,129 | $162:$1 |
| Coahoma County, Mississippi | $154,080,606 | $331,822 | $464:$1 |
| Humphreys County, Mississippi | $76,009,596 | $256,176 | $297:$1 |
| Issaquena County, Mississippi | $39,123,121 | $15,572 | $2,512:$1 |
| Leflore County, Mississippi | $147,107,014 | $280,343 | $525:$1 |
| Sharkey County, Mississippi | $73,046,408 | $106,583 | $685:$1 |
| Sunflower County, Mississippi | $189,003,464 | $1,007,703 | $188:$1 |
| Washington County, Mississippi | $185,145,216 | $515,654 | $359:$1 |
| Andrew County, Missouri | $29,445,553 | $238,597 | $123:$1 |
| Atchison County, Missouri | $74,361,609 | $63,086 | $1,179:$1 |
| Clark County, Missouri | $35,101,610 | $26,512 | $1,324:$1 |
| Dunklin County, Missouri | $106,555,773 | $612,611 | $174:$1 |
| Holt County, Missouri | $58,078,391 | $59,498 | $976:$1 |
| Johnson County, Missouri | $30,703,725 | $193,222 | $159:$1 |
| Knox County, Missouri | $29,158,069 | $268,931 | $108:$1 |
| Lafayette County, Missouri | $62,207,122 | $111,141 | $560:$1 |
| Lewis County, Missouri | $31,436,410 | $16,912 | $1,859:$1 |
| Marion County, Missouri | $32,861,800 | $101,347 | $324:$1 |
| Mississippi County, Missouri | $77,803,375 | $98,517 | $790:$1 |
| New Madrid County, Missouri | $180,120,510 | $207,488 | $868:$1 |
| Nodaway County, Missouri | $64,964,942 | $195,696 | $332:$1 |
| Pemiscot County, Missouri | $108,362,335 | $43,899 | $2,468:$1 |
| Saint Charles County, Missouri | $36,101,578 | $601 | $60,069:$1 |
| Saline County, Missouri | $89,512,767 | $704,607 | $127:$1 |
| Schuyler County, Missouri | $9,596,735 | $12,410 | $773:$1 |
| Scotland County, Missouri | $29,519,750 | $83,970 | $352:$1 |
| Scott County, Missouri | $61,145,762 | $372,150 | $164:$1 |
| Stoddard County, Missouri | $224,228,698 | $368,882 | $608:$1 |
| Burt County, Nebraska | $72,718,951 | $157,802 | $461:$1 |
| Cass County, Nebraska | $76,991,831 | $105,582 | $729:$1 |
| Dakota County, Nebraska | $33,373,749 | $2,623 | $12,724:$1 |
| Nemaha County, Nebraska | $48,211,455 | $890,493 | $54:$1 |
| Otoe County, Nebraska | $73,639,078 | $87,604 | $841:$1 |
| Sarpy County, Nebraska | $22,930,841 | $16,695 | $1,374:$1 |
| Thurston County, Nebraska | $45,990,674 | $72,596 | $634:$1 |
| Washington County, Nebraska | $54,260,179 | $33,079 | $1,640:$1 |
| Champaign County, Ohio | $64,747,307 | $78,962 | $820:$1 |
| Clark County, Ohio | $48,370,763 | $35,922 | $1,347:$1 |
| Clermont County, Ohio | $14,549,249 | $12,664 | $1,149:$1 |
| Clinton County, Ohio | $65,664,226 | $51,652 | $1,271:$1 |
| Darke County, Ohio | $88,057,033 | $417,733 | $211:$1 |
| Fayette County, Ohio | $67,891,776 | $95,548 | $711:$1 |
| Greene County, Ohio | $43,753,040 | $8,634 | $5,068:$1 |
| Highland County, Ohio | $51,001,267 | $330,324 | $154:$1 |
| Logan County, Ohio | $52,580,129 | $225,278 | $233:$1 |
| Miami County, Ohio | $48,862,082 | $113,554 | $430:$1 |
| Ross County, Ohio | $41,935,030 | $83,549 | $502:$1 |
| Shelby County, Ohio | $53,547,553 | $422,979 | $127:$1 |
| Warren County, Ohio | $21,382,408 | $48,199 | $444:$1 |
| Lake County, South Dakota | $61,061,325 | $1,000,133 | $61:$1 |
| Lincoln County, South Dakota | $77,720,509 | $121,111 | $642:$1 |
| Minnehaha County, South Dakota | $95,110,831 | $289,252 | $329:$1 |
| Moody County, South Dakota | $64,823,589 | $206,610 | $314:$1 |
| Union County, South Dakota | $72,151,532 | $517,237 | $139:$1 |
| Crockett County, Tennessee | $70,510,450 | $226,809 | $311:$1 |
| Dyer County, Tennessee | $59,705,131 | $59,552 | $1,003:$1 |
| Gibson County, Tennessee | $78,219,849 | $155,499 | $503:$1 |
| Lake County, Tennessee | $30,188,354 | $24,888 | $1,213:$1 |
| Lauderdale County, Tennessee | $58,122,775 | $443,771 | $131:$1 |
| Obion County, Tennessee | $58,626,382 | $229,781 | $255:$1 |
| Robertson County, Tennessee | $26,799,823 | $115,051 | $233:$1 |
| Green County, Wisconsin | $66,647,595 | $71,471 | $933:$1 |
| Iowa County, Wisconsin | $46,186,705 | $247,784 | $186:$1 |
| Lafayette County, Wisconsin | $83,487,509 | $494,547 | $169:$1 |
| Total | $30,075,204,529 | $75,624,639 | $398:$1 |
* Includes payments for the Environmental Quality Incentives Program, the Wetlands Reserve Program, and all payments in the Conservation Reserve Program if the producer received a CRP - Wetlands or CRP - Riparian Area contract payment.
Related Links
Louisiana Universities Marine Consortium hypoxia page
http://www.gulfhypoxia.net
Hypoxia Watch interactive maps homepage
http://www.ncddc.noaa.gov/ecosystems/hypoxia
Gulf of Mexico Hypoxia Assessment Reports
http://www.nos.noaa.gov/products/pubs_hypox.html
USGS Nutrient Flux Estimates for the Gulf of Mexico
http://co.water.usgs.gov/hypoxia/html/nutrients_new.html
USGS SPARROW model home page
http://water.usgs.gov/nawqa/sparrow/
Naples Daily News Report: "Deep Trouble: The Gulf in Peril"
http://web.naplesnews.com/deeptrouble/video/
USDA: Saving energy by saving fertilizer
http://nfat.sc.egov.usda.gov/
Dead Zones Worldwide
The BBC reported on March 29, 2004:
Since the 1960s the number of oxygen-starved areas has doubled every decade, as human nitrogen production has outstripped natural sources.
About 75% of the world's fish stocks are already being overexploited, but UNEP (UN Environmental Program) says the dead zones, which now number nearly 150 worldwide, will probably prove a greater menace.
It quotes research by a team of scientists at the Virginia Institute of Marine Science in the US.
They concluded: "The history and pattern of human disturbance in terrestrial, aquatic, coastal and oceanic ecosystems have brought us to a point at which oxygen depletion is likely to become the keystone impact for the 21st Century, replacing the 20th Century keystone of overfishing."
Read more from the BBC.
Read the report from the UNEP.
About This Report
The Environmental Working Group would like to thank the dedicated foundations whose support made this project possible: The McKnight Foundation, Wallace Genetic Foundation, and The Joyce Foundation. We would also like to thank the many people who provided assistance during the writing of this report. Sara Duke, Richard Bell, Richard Smith, Nancy Rabalais, Dave Wolock, Bob Larson, Tom Nolan, Bill Battaglin, Greg McIsaac, Thomas Jordan, Don Boesch and especially Richard Alexander provided us with data, advice, and invaluable insight. The opinions expressed in this report are those of the authors and do not necessarily reflect the views of the supporters listed above. EWG is responsible for any errors of fact or interpretation contained in this report.
News Release - Farm Subsidy Reform Key to Restoring Gulf of Mexico "Dead Zone"
Programs Waste Taxpayers' Money While Subsidizing Pollution Threatening Top U.S. Fishery
(WASHINGTON, April 10) - Each year, an average of $270 million worth of wasted fertilizer flows down the Mississippi River into the Gulf of Mexico, creating a "Dead Zone" of more than 5,000 square miles that is completely devoid of marine life. Now, a new Environmental Working Group (EWG) analysis of government and industry data shows that reforms of wasteful federal farm programs could lead the way to restoration of America's most valuable fishery.
In the wake of last summer's hurricanes, many wonder how much more environmental abuse the Gulf and its fishery can withstand. But EWG found that the vast majority of fertilizer pollution comes from a small area of heavily subsidized cropland along the Mississippi and its tributaries, where taxpayer-funded farm subsidies overwhelm spending on water quality and conservation by more than 500 to 1.
Shifting a modest portion of crop subsidies, particularly those that go to the largest and wealthiest growers, into programs that encourage more careful fertilizer use, wetland restoration and the streamside planting of grass and trees to absorb runoff, could reduce dead zone pollution significantly—while also boosting the bottom line for family farms.
EWG researchers culled computerized records from nine different federal and commercial databases and found that by shifting a share of farm subsidies to proven conservation programs, Congress could cut the damage and save farmers hundreds of millions of dollars.
"Taxpayers have been subsidizing wasteful commercial agricultural practices that hurt an important source of our fish, when we could be paying family farms to help us solve the problem," said EWG President Ken Cook. "Given how badly the Gulf needs help right now, it's a common-sense solution."
Congress has historically steered billions of dollars away from programs that reward farmers for cutting pollution, erosion and fertilizer pollution and toward antiquated programs that pay farms based on past production of grains and cotton. The conservation programs turn down thousands of farmers a year due to a lack of money.
EWG analysts quantified for the first time the extent to which pollution and subsidies are inter-related. They found that:
- Farmlands in 15 percent of the Mississippi River Basin send 80 percent of the critical spring surge of fertilizer pollution into the Gulf.
- Farms in 124 counties that make up 5 percent of the Basin send 40 percent of the spring fertilizer pollution load to the Gulf.
- In those top polluting 124 counties, taxpayers spent 500 times more money on crop subsidies than on conservation programs.
- In the top fertilizer-polluting states of Iowa, Illinois and Indiana, 11,000 farmers were denied conservation payments in 2004 because the programs had no money.
# # #
The Environmental Working Group and Environmental Working Group Action Fund are nonprofits that use the power of information to protect public health and the environment. The group's work on farm subsidies, including the searchable Web site listing every subsidy recipient from 1995 onward, is available at https://www.ewg.org/farm/.