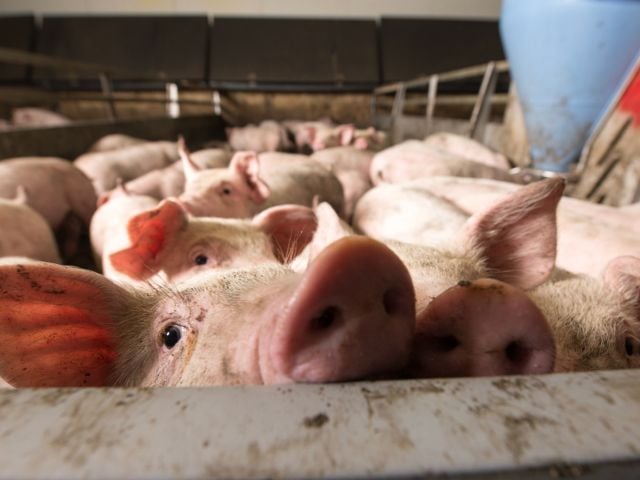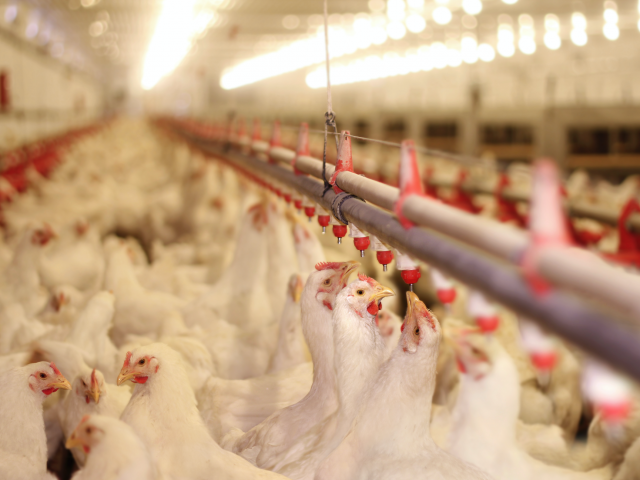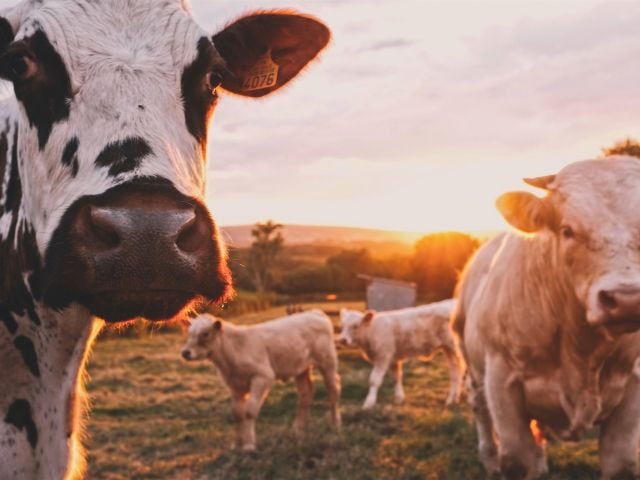
North Carolina boasts the nation’s second biggest hog farming industry, worth $3 billion in hog and pig sales in 2012 alone, according to the U.S. Department of Agriculture. It ranks third among the states for poultry production.
Over two decades alone, North Carolina’s swine population has nearly doubled, from 5.1 million in 1992 to 9.5 million by 2012, according to the USDA Census of Agriculture. During the same period, the state’s broiler chicken production increased by 60 million, to 148 million animals.
This boom in production has delivered financial benefits, but also dire environmental consequences to North Carolina’s verdant backcountry and the people who live in it.
Simply put, the more animals you have, the more waste you have to deal with.
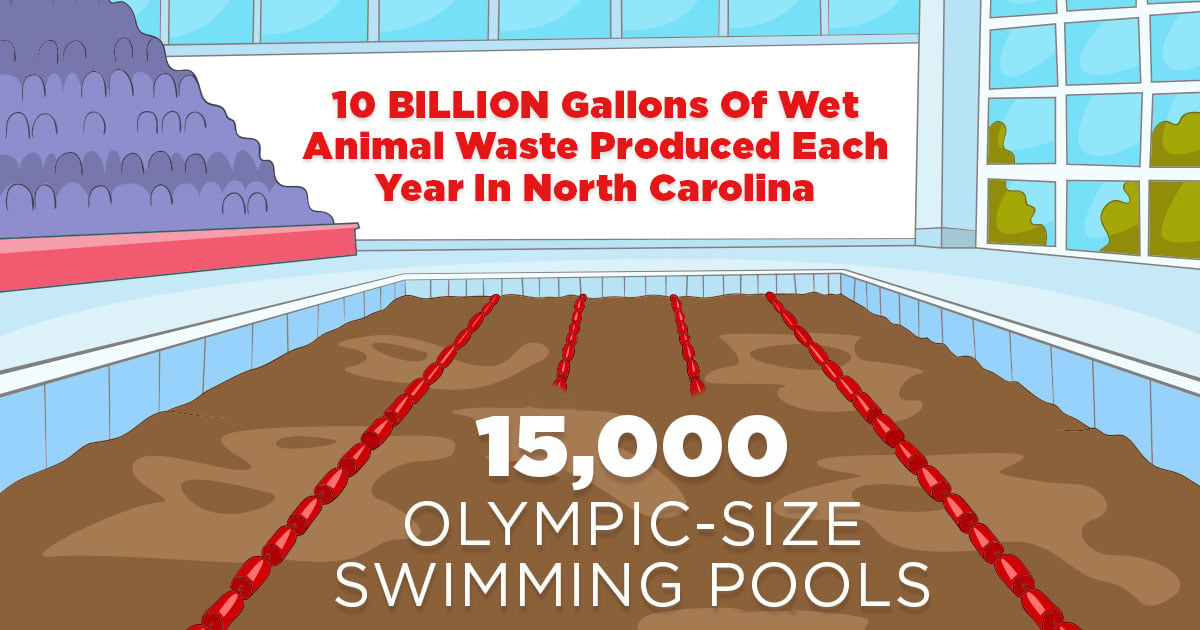
A new analysis by EWG and Waterkeeper Alliance shows that wet waste, primarily from pigs, in North Carolina's industrial agricultural operations produce almost 10 billion gallons of fecal waste yearly, enough to fill more than 15,000 Olympic-size swimming pools.
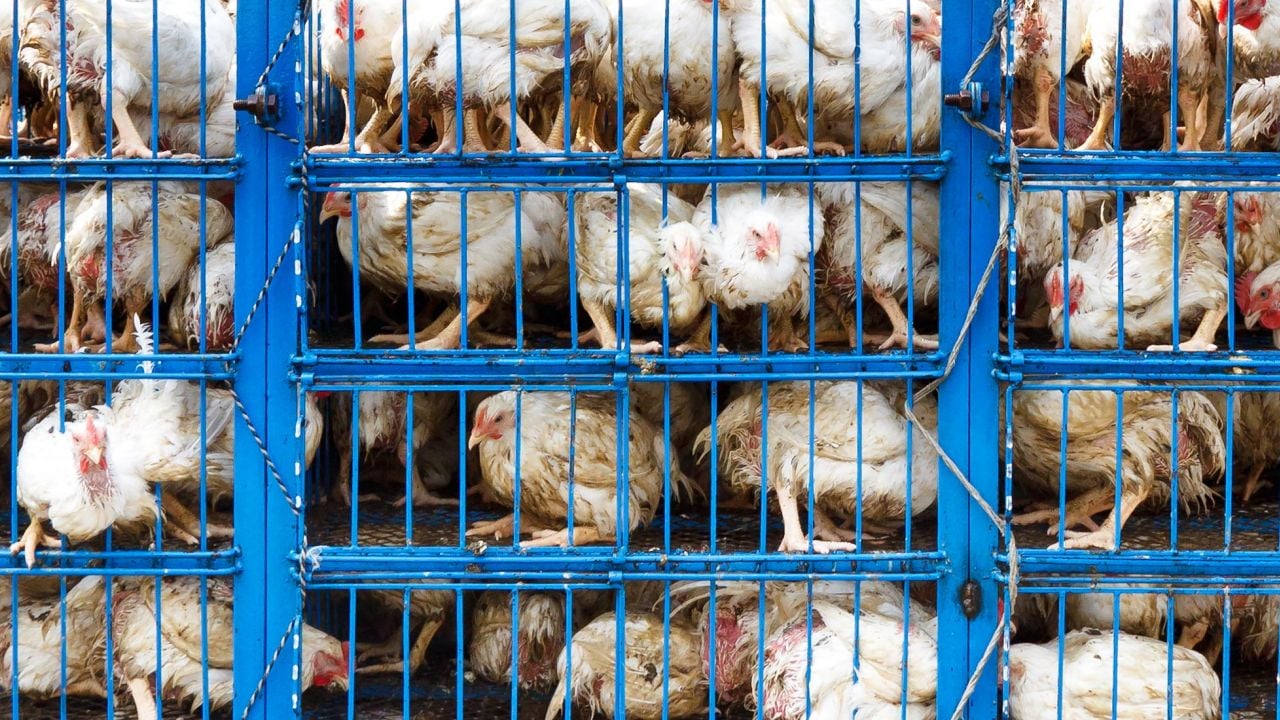
Thousands of poultry feeding operations housing more than 200 million birds create 2 million tons of dry waste per year (EWG-Waterkeepers 2016).
The geographic density of these operations threatens the rural environment and its residents. The analysis shows that Duplin and Sampson counties alone produced about 40 percent of the state’s total wet animal manure and 18 percent of the dry waste. Nestled near the Atlantic coast, these counties are beset with numerous air and water quality problems.
In 2014, the North Carolina Environmental Justice Network, Rural Empowerment Association for Community Help and Waterkeeper Alliance, supported by EarthJustice, filed a complaint with the Environmental Protection Agency Office of Civil Rights, arguing that North Carolina’s lax regulation of hog waste disposal disproportionately affected communities of color in rural areas.
Farmers often apply bacteria-laden animal waste to agricultural fields as fertilizer or it’s dumped in open pits euphemistically called “waste lagoons.” They are really open dumps for filth, and they send disease-causing microbes and toxic chemicals into surface water and air.
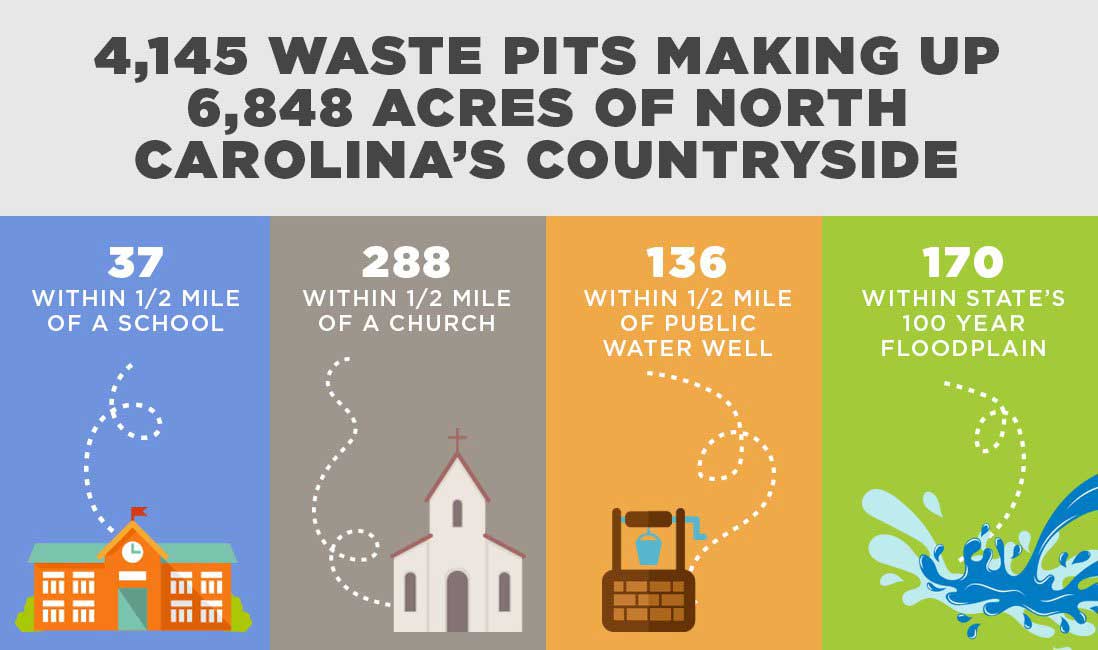
Until recently, many North Carolinians were unaware of the actual size and scope of the animal waste pits. EWG and Waterkeepers research found more than 4,100 of them extending over 6,800 acres, often located in low-lying spots near bodies of water.
EWG and Waterkeepers have created a series of interactive maps, the first of their kind, to enable citizens, lawmakers and policymakers to visualize and interpret the state’s swine, poultry and cattle operations by zooming in on selected areas. These maps are meant to serve as investigative tools to empower people to assess the social and environmental impacts of industrialized animal farms in their backyards.
EWG and Waterkeepers launched the mapping project to fill in yawning gaps in the North Carolina state agricultural regulatory system. The state regulates swine operations, requiring them to obtain permits and meet reporting obligations. But because of legal exemptions from regulation, the general public cannot find out salient facts about the state’s thousands of poultry operations.


Data and Methodology
Data provided on the maps represent estimations of locations and statistics in an attempt to accurately document animal feeding operations and their impact on the landscape. EWG and Waterkeeper Alliance assume no responsibility for locational accuracy, errors or omissions represented on the maps.
Animal Feeding Operation Map Attributes
- County: North Carolina county in which animal feeding operation exists.
- Operation: “FACILITY NAME” from N.C. Department of Environmental Quality List of Permitted Animal Facilities (January 2015) for all cattle and swine operations. For various poultry operations “OWNNAME” was attributed to the location from the N.C. Parcel Boundaries (June 2013).
- Status: Operational status from N.C. Department of Environmental Quality List of Permitted Animal Facilities (January 2015); all poultry operations documented as “Unknown.”
- Assumed Type: Animal operation category (i.e. Swine - Farrow to Wean) from “REGULATED ACTIVITY” of the N.C. Department of Environmental Quality List of Permitted Animal Facilities (January 2015), or most common poultry type (broiler, layer, pullet, turkey) appearing at the county level of the Poultry - Inventory and Sales USDA AG Census 2007 and 2012.
- Lagoon Count: “NUMBER OF LAGOONS” from N.C. Department of Environmental Quality List of Permitted Animal Facilities (January 2015), a count of waste holding pools for an individual operation.
- Barn Count: Number of poultry barns visible at the location from Waterkeeper Alliance contracted by Justin S. Quinlivan.
- Estimated Animal Count: Animal count from “ALLOWABLE COUNT” of the N.C. Department of Environmental Quality List of Permitted Animal Facilities (January 2015), or aggregated count of highest number of poultry types (broiler, layer, pullet, turkey) between 2007 and 2012 from Poultry - Inventory and Sales USDA AG Census 2007 and 2012.
- Estimated Waste Output: Annual estimated waste output calculated using the 2016 North Carolina Agricultural Chemicals Manual, specifically Chapter IV-Fertilizer Use, page 62,“Livestock & Poultry Manure Production Rates and Nutrient Content.” See WASTE ESTIMATE METHODOLOGY below for more information.
- Agricultural Land within One Mile: Total agricultural land within a one mile radius of location point calculated using the 2015 USDA Cropland Data Layer.
- Estimated Application Rate: “Estimated Waste Output” divided by the “Ag Land within One Mile.”
- Data Source: Owner and maintainer of dataset.
Watershed Map Attributes
- Dry Waste Output: Annual estimated dry waste output calculated using the 2016 North Carolina Agricultural Chemicals Manual, specifically Chapter IV-Fertilizer Use, page 62, “Livestock & Poultry Manure Production Rates and Nutrient Content.” See Waste Estimate Methodology below for more information.
- Wet Waste Output: Annual estimated wet waste output calculated using the 2016 North Carolina Agricultural Chemicals Manual specifically Chapter IV-Fertilizer Use, page 62, “Livestock & Poultry Manure Production Rates and Nutrient Content.” See Waste Estimate Methodology below for more information.
- Total Confined Animals: Aggregate count of animals found in HUC-8, HUC-10 or HUC-12 Watershed.
- Hogs and Pigs: Aggregate count of swine found in HUC-8, HUC-10 or HUC-12 Watershed.
- Poultry: Aggregate count of poultry found in HUC-8, HUC-10 or HUC-12 Watershed.
- Cattle and Calves: Aggregate count of cattle found in HUC-8, HUC-10 or HUC-12 Watershed.
- Poultry Barns: Aggregate count of poultry barns in HUC-8, HUC-10 or HUC-12 Watershed.
- Waste Lagoons: Aggregate count of waste lagoons in HUC-8, HUC-10 or HUC-12 Watershed.
- Animal Feeding Operations: Aggregate count of animal feeding operations in HUC-8, HUC-10 or HUC-12 Watershed.
County Map Attributes
- Dry Waste Output: Aggregate of estimated dry waste within county calculated using the 2016 North Carolina Agricultural Chemicals Manual, specifically Chapter IV-Fertilizer Use, page 62, “Livestock & Poultry Manure Production Rates and Nutrient Content.” See Waste Estimate Methodology below for more information.
- Wet Waste Output: Aggregate of estimated wet waste within county calculated using the 2016 North Carolina Agricultural Chemicals Manual, specifically Chapter IV-Fertilizer Use, page 62, “Livestock & Poultry Manure Production Rates and Nutrient Content.” See Waste Estimate Methodology below for more information.
- Total Confined Animals: Aggregate animal count from “ALLOWABLE COUNT” of the N.C. Department of Environmental Quality List of Permitted Animal Facilities (January 2015), or county-level poultry type (broiler, layer, pullet, turkey) from Poultry - Inventory and Sales USDA AG Census 2007 and 2012 within the county boundary.
- Hogs and Pigs: Aggregate animal count from “ALLOWABLE COUNT” of the N.C. Department of Environmental Quality List of Permitted Animal Facilities (January 2015) within the county boundary.
- Poultry: Aggregate animal count from Poultry - Inventory and Sales USDA AG Census 2007 and 2012 within the county boundary.
- Cattle and Calves: Aggregate animal count from “ALLOWABLE COUNT” of the N.C. Department of Environmental Quality List of Permitted Animal Facilities (January 2015) within the county boundary.
- Poultry Barns: Aggregate count of poultry barns visible at the location from Waterkeeper Alliance within the county boundary.
- Waste Lagoons: Aggregate count of waste lagoons operations within the county boundary.
- Animal Feeding Operations: Aggregate count of animal feeding operations within the county boundary.
Block Map Attributes
- Total Population: The total population within the block boundary. Data estimates from the 2010 U.S. Census and various U.S. Census surveys.
- Percent African American: The percent of African Americans within the total population of the block boundary. Data estimates from the 2010 U.S. Census and various U.S. Census surveys.
- Percent Native American: The percent of American Indian and Alaska Native within the total population of the block boundary. Data estimates from the 2010 U.S. Census and various U.S. Census surveys.
- Percent Hispanic (any race): The percent of Hispanic (any race) within the total population of the block boundary. Data estimates from the 2010 U.S. Census and various U.S. Census surveys.
- Percent Under 18: The percent of individuals under the age of 18 within the total population of the block boundary. Data estimates from the 2010 U.S. Census and various U.S. Census surveys.
- Percent Living in Poverty: The percent of individuals living below the poverty line within the total population of the block boundary. Data estimates from the 2010 U.S. Census and various U.S. Census surveys.
- Dry Waste Output: Aggregate amount of estimated dry waste within block group calculated using the 2016 North Carolina Agricultural Chemicals Manual specifically Chapter IV-Fertilizer Use, page 62, “Livestock & Poultry Manure Production Rates and Nutrient Content.” See Waste Estimate Methodology below for more information.
- Wet Waste Output: Aggregate amount of estimated wet waste within block group calculated using the 2016 North Carolina Agricultural Chemicals Manual specifically Chapter IV-Fertilizer Use, page 62, “Livestock & Poultry Manure Production Rates and Nutrient Content.” See Waste Estimate Methodology below for more information.
- Total Confined Animals: Aggregate animal count taken from “ALLOWABLE COUNT” of the N.C. Department of Environmental Quality List of Permitted Animal Facilities (January 2015) or county level poultry type (broiler, layer, pullet, turkey) from Poultry - Inventory and Sales USDA AG Census 2007 and 2012 within the block boundary.
- Hogs and Pigs: Aggregate animal count taken from “ALLOWABLE COUNT” of the N.C. Department of Environmental Quality List of Permitted Animal Facilities (January 2015) within the block boundary.
- Poultry: Aggregate animal count taken from Poultry - Inventory and Sales USDA AG Census 2007 and 2012 within the block boundary.
- Cattle and Calves: Aggregate animal count taken from “ALLOWABLE COUNT” of the N.C. Department of Environmental Quality List of Permitted Animal Facilities (January 2015) within the block boundary.
- Poultry Barns: Aggregate count of poultry barns visible at the location taken from Waterkeeper Alliance within the block boundary.
- Waste Lagoons: Aggregate count of waste lagoons within the block boundary.
- Animal Feeding Operations: Aggregate count of animal feeding operations within the block boundary.
Summary Maps
Block Group Map - Animal feeding operation points were aggregated and summarized using 2010 U.S. Census data from the latest American Housing Survey (AHS).
County Map - Animal feeding operation points were aggregated and summarized using North Carolina county boundaries.
Watershed Map - Animal feeding operation points were aggregated and summarized using USGS hydrologic unit code 8 (Sub basin), 10 (Watershed), and 12 (Sub watershed) drainage areas in North Carolina.
Animal Feeding Operation Map Layers
100 Year Floodplain – Data representing the 100 year floodplain was compiled from North Carolina Flood Risk Information System “effective” and “preliminary” maps.
Impaired Waterway - Data representing the impaired waterways in North Carolina were compiled from the Environmental Protection Agency’s list of polluted waters – Implementing Clean Water Act Section 303(d).
Cattle & Swine Operations - Data representing the cattle and swine operations were compiled from the North Carolina Department of Environmental Quality’s Animal Feeding Operation Permit (January 2015) dataset.
Poultry Operations - Data representing the poultry operations and associated barn counts were compiled by the Waterkeeper Alliance contracted by Justin S. Quinlivan.
Waste Lagoons - Data representing the perimeter measurements of waste lagoons were compiled by EWG. Lagoons polygons were heads-up digitized using 2014 USDA NAIP aerial photography. The North Carolina Department of Environment and Natural Resources Division of Water Quality Swine Lagoon point layer served as a proxy for known swine lagoons. Visible lagoons on aerial photography not marked with the N.C. point layer were also capture and classified as unknown.
Waste Estimate Methodology
Poultry Waste Estimates
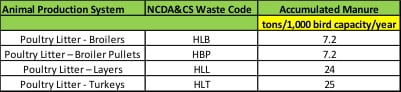
To calculate the poultry waste universe, EWG took the highest county-level estimates found in the USDA Agricultural Census between 2007 and 2012 for “Pullet”, “Turkey”, “Layer” and “Broiler.” Those county-level numbers were then evenly distributed by the number of poultry barns associated within an individual operation, within the county for each poultry category (as documented by Waterkeeper Alliance). Manure outputs were calculated using the specific poultry type and count from the 2016 North Carolina Agricultural Chemicals Manual, specifically Chapter IV-Fertilizer Use, page 62, “Livestock & Poultry Manure Production Rates and Nutrient Content” (see Figure 1 below).
Figure 1- Manure Volume and Weight in Typical North Carolina Animal Production Systems
Swine Waste Estimates
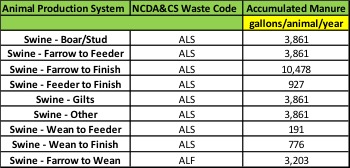
To calculate the swine waste universe, EWG used permit data from the North Carolina Department of Environmental Quality to determine animal type and count. Manure outputs were calculated using the specific type and count from the 2016 North Carolina Agricultural Chemicals Manual, specifically Chapter IV-Fertilizer Use, page 62, "Livestock & Poultry Manure Production Rates and Nutrient Content." For animal types that did not appear on the 2016 North Carolina Agricultural Chemicals Manual, EWG used manure metrics for a similar type of animal. This was done for Swine - Boar/Stud, Swine – Gilts, and Swine – Other (see Figure 2 below).
Figure 2- - Manure Volume and Weight in Typical North Carolina Animal Production Systems
Cattle Waste Estimates
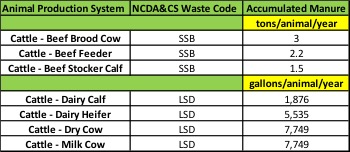
To calculate the cattle waste universe, EWG used the permit data from the North Carolina Department of Environmental Quality to determine animal type and count. EWG Manure outputs were calculated using the specific type and count from the 2016 North Carolina Agricultural Chemicals Manual, specifically Chapter IV-Fertilizer Use, page 62, “Livestock & Poultry Manure Production Rates and Nutrient Content.” For animal types that did not appear on the 2016 North Carolina Agricultural Chemicals Manual, EWG used manure metrics for a similar type of animal. This was done for Cattle - Dry Cow (see Figure 3 below).
Figure 3- - Manure Volume and Weight in Typical North Carolina Animal Production Systems
EWG and Waterkeepers researchers created the maps by harnessing a variety of federal and state geographical data and by analyzing high-resolution aerial photography. The aerial images allowed researchers to quantify the length and breadth of pig waste pits, and to determine the locations and numbers of barns at poultry operations.
The researchers drew on government and academic data to supplement these analyses.
The EWG-Waterkeepers study confirms and expands on earlier research to reach an inescapable conclusion: Animal feeding operations are degrading the quality of life for hundreds of thousands of rural residents.
To protect the citizens of North Carolina, and their landscape and natural resources, policymakers must demand more accountability and bring about more effective regulation of industrial livestock agriculture.
Below are some of the newly available, alarming results generated from the EWG – Waterkeeper maps:
- 10 billion gallons of wet animal waste (swine and cattle) produced each year in North Carolina, the equivalent of 15,000 Olympic-size swimming pools.
- Annually, poultry operations in the state produce more than 2 million tons of dry animal waste.
- 4,145 waste pits make up 6,848 acres of North Carolina's countryside.
- 37 waste pits are within a half mile of a school.
- 288 waste pits are within a half mile of a church.
- 136 waste pits are within a half mile of a public water well.
- 170 waste pits are within the state’s 100-year floodplain.
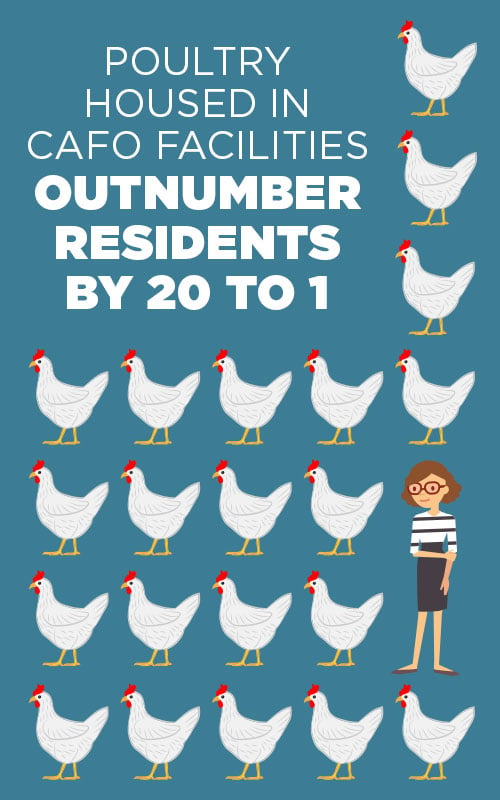
- Poultry housed in CAFO facilities outnumber residents by 20 to 1.