 In December 2015, the 1,500 residents of Erie, Ill., received a warning that the community’s tap water should not be given to babies under 6 months old, or used to mix formula or juice for those infants.
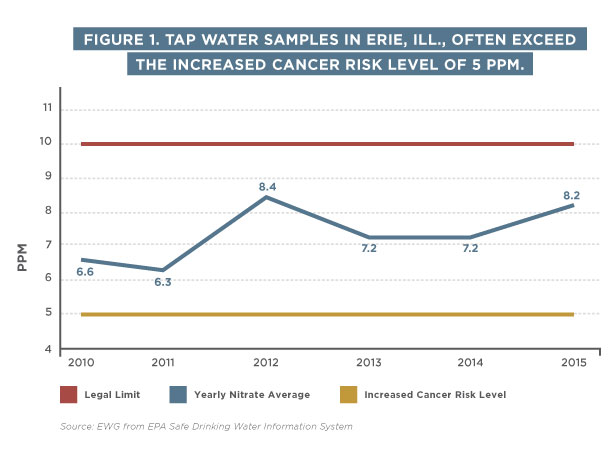
The alert said the water contained high levels of nitrate, a chemical in commercial fertilizer and manure that can cause serious illness or death to infants who ingest too much of it. Tests of the water had found an average nitrate level of 11 parts per million, or ppm, exceeding the Environmental Protection Agency’s legal limit of 10 ppm. Within weeks the level dropped below the legal limit, but less than a year later, in October 2016, residents were again warned that their water was unsafe for infants.
For many small towns throughout the Corn Belt, this alarming scenario is a regular occurrence. Hundreds of communities in the region suffer seasonal spikes in nitrate that push the level above the legal limit. The limit was set 25 years ago to protect against so-called blue baby syndrome. But even when levels are half the legal limit, the water may pose a long-term threat. Recent studies by the National Cancer Institute have linked nitrate in drinking water at just 5 ppm with increased risk of colon, kidney, ovarian and bladder cancers.
EWG’s Tap Water Database, which collects test data from almost 50,000 utilities nationwide, shows that from 2010 to 2015, nitrate levels in Erie averaged 7.5 ppm, and 85 percent of all samples tested in that period were at or above 5 ppm. The highest level detected in the village was 14 ppm – 140 percent of the legal limit and almost three times the increased cancer risk level, which EWG endorses as a health-protective guideline.
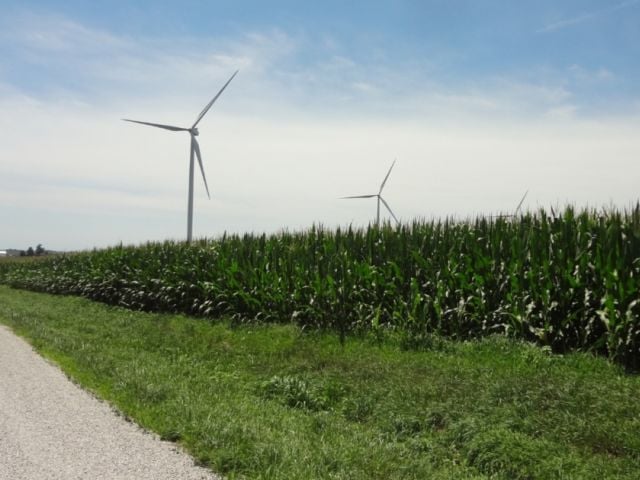
Erie lies within one of the most productive corn-growing regions of the nation. In 2016, the 12 counties in the northwest corner of Illinois produced more than 400 million bushels of corn on 2 million acres. Those corn fields are treated with hundreds of thousands of pounds of fertilizer and manure each year.
Analysis by the Illinois Geologic Survey found that many of the region’s underground, or groundwater, aquifers are highly susceptible to leaching of chemicals from the soil above them. By overlaying the state geological survey’s leaching zones with data from the U.S. Department of Agriculture, EWG found that more than a third of northwest Illinois farmland sits above aquifers classified as “high” to “excessive” for susceptibility to nitrate leaching. So it’s not surprising that the Tap Water Database shows that from 2014 to 2015 Erie was one of 11 communities in the region whose public water systems had an average nitrate level of 5 ppm or more.
Figure 2. Twelve counties in northwest Illinois produce over 400 million bushels a year of corn atop drinking water aquifers highly susceptible to nitrate leaching. Eleven public water systems in the region had nitrate contamination above the level linked to increased cancer risk.
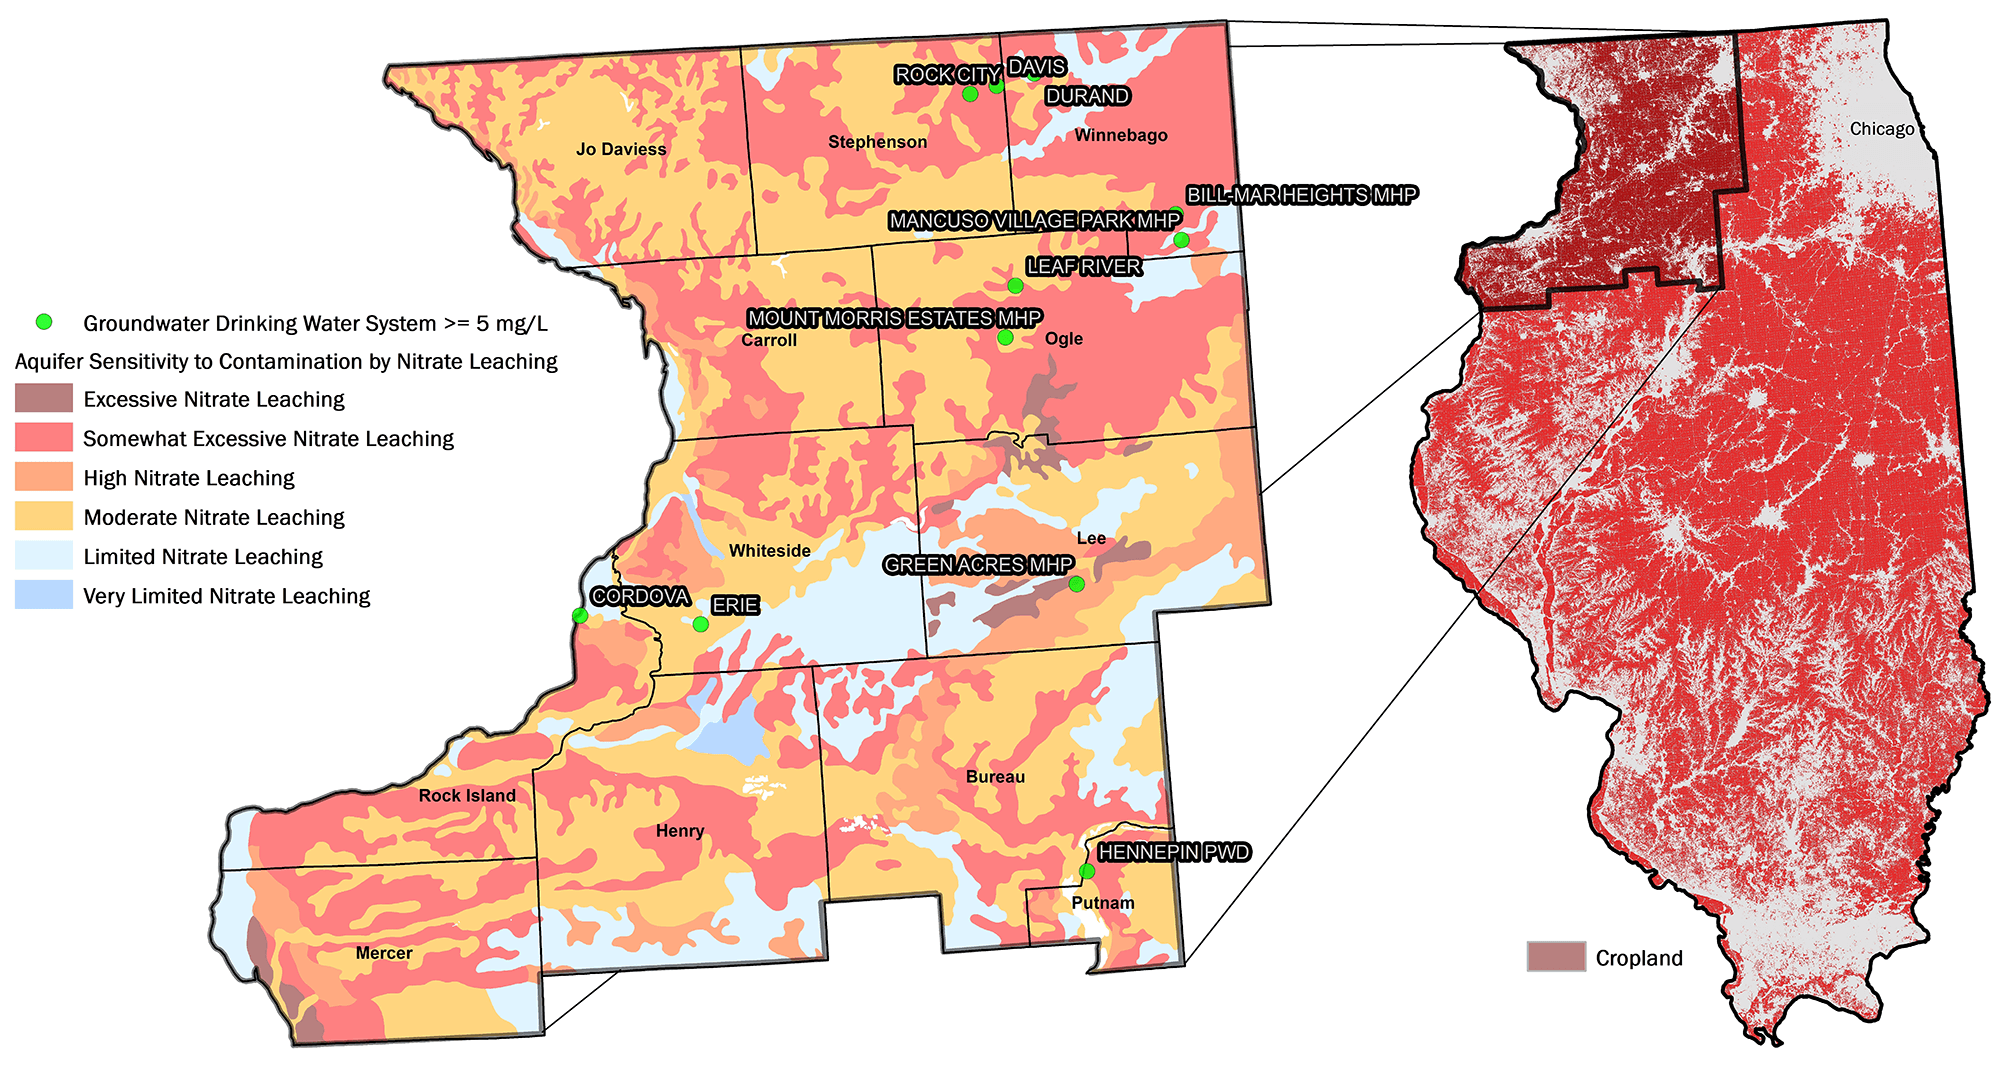
Source: EWG, from the USDA Cropland Data Layer, EPA Safe Drinking Water Information System and the Illinois Geologic Survey – Aquifer Sensitivity to Contamination by Nitrate Leaching
Locating U.S. groundwater systems with nitrate
More than 38,000 public water systems, serving around 90 million Americans, depend on groundwater. According to the EWG Tap Water Database, in 2014 and 2015 more than 1,600 of those systems, serving 3.3 million people, had average nitrate levels of 5 ppm or higher. More than 100 systems had average nitrate levels exceeding the legal limit of 10 ppm. The states with the most systems above the legal limit were Texas, California and Oklahoma.
Another 44 million Americans depend on groundwater from private wells. According to a study by the U.S. Geological Survey, or USGS, an estimated 4.4 percent of private wells in the nation have nitrate levels in excess of the legal limit, most frequently in agricultural areas.
To better understand the sources of nitrate contamination of groundwater, the USGS developed a model that predicts nitrate contamination in drinking water aquifers approximately 10 to 50 meters deep.
Figure 3. A USGS model predicts nitrate contamination in shallow groundwater aquifers that supply public drinking water systems.
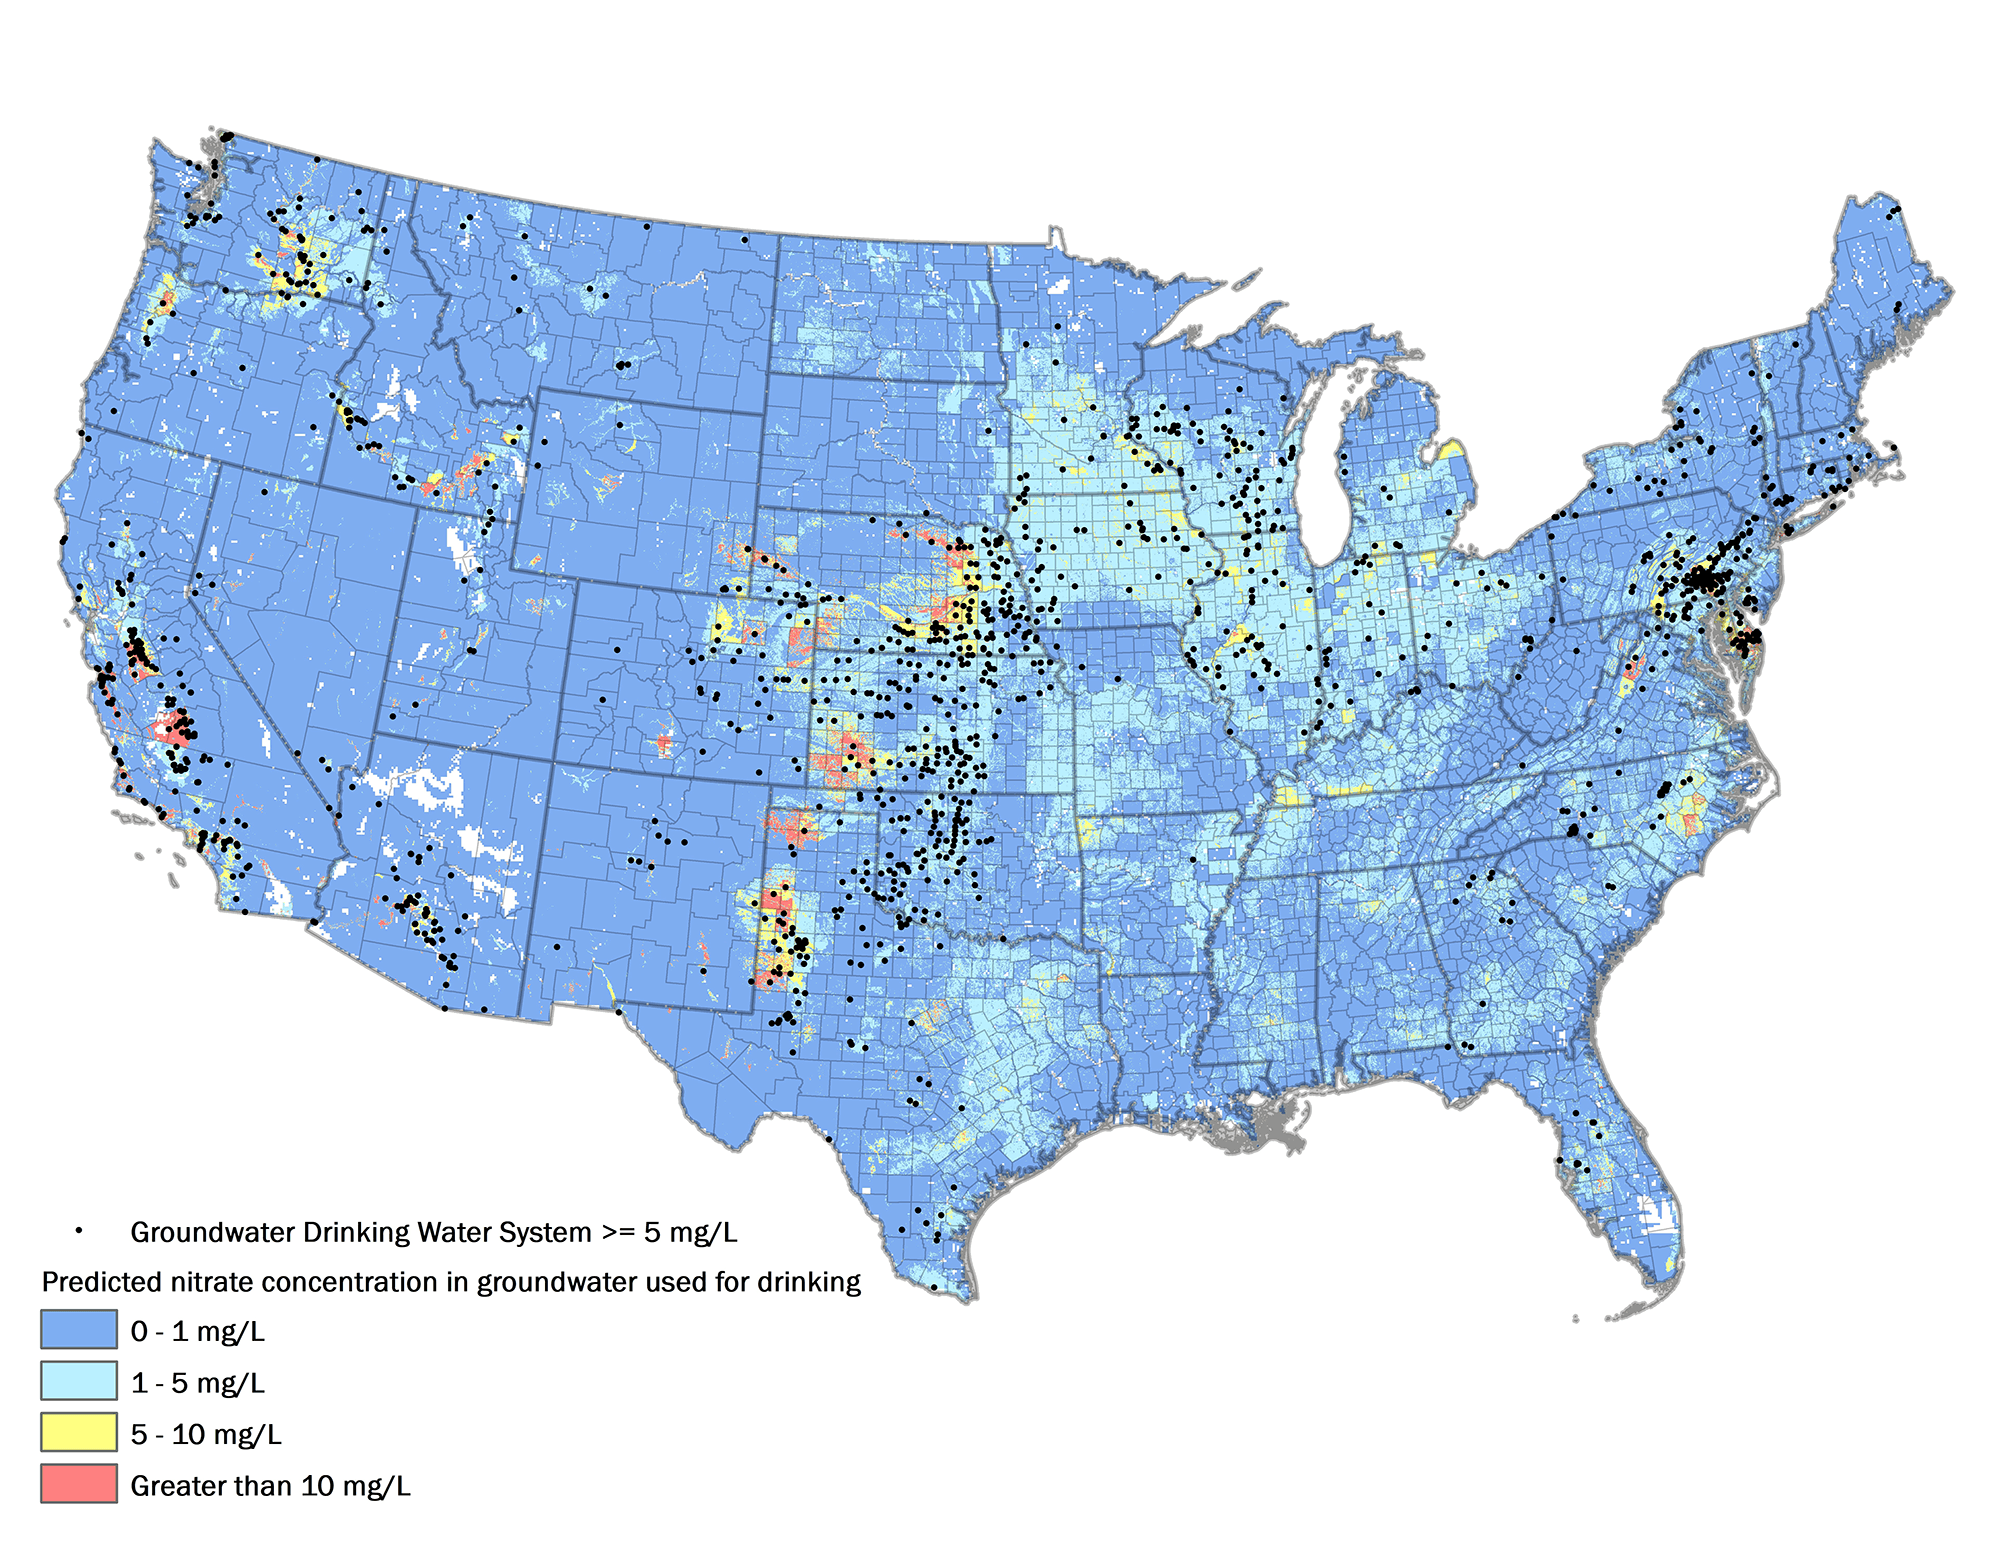
Source: EWG, from the USGS Predicted Nitrate Concentration in U.S. Groundwater Used for Drinking and the EPA Safe Drinking Water Information System
EWG analysts combined the USGS data for areas with predicted nitrate contamination of 5 ppm or above with the USDA’s Cropland Data Layer, which identifies farm fields by specific crops. This provides a clearer understanding of which aboveground sources may be responsible for groundwater contamination.
We found that in Illinois, cropland overlaid approximately three-fourths of the areas where aquifers were predicted to have 5 ppm or more of nitrate. In Nebraska, almost 6 million acres of cropland overlaid areas with aquifers where predicted nitrate contamination was at or above 5 ppm. In 15 states, cropland overlaid more than half of the areas where aquifers were predicted to have nitrate levels of at least 5 ppm.
Figure 4. States with cropland planted on over half of the areas susceptible to nitrate contamination of groundwater.
| State | Agriculture with nitrate contamination above 5 ppm (acres) | Predicted contaminated area >= 5 ppm (acres) | Agriculture and contaminated area overlap |
|---|---|---|---|
| Illinois | 1,466,818 | 1,935,807 | 76% |
| South Dakota | 2,471 | 3,459 | 71% |
| Michigan | 474,443 | 665,204 | 71% |
| Nebraska | 5,964,867 | 8,581,451 | 70% |
| Idaho | 1,340,543 | 2,122,627 | 63% |
| Minnesota | 1,003,738 | 1,590,110 | 63% |
| Ohio | 346,439 | 554,249 | 63% |
| Kentucky | 545,606 | 880,923 | 62% |
| Iowa | 932,822 | 1,525,360 | 61% |
| Kansas | 2,425,827 | 4,012,238 | 60% |
| Indiana | 389,682 | 662,484 | 59% |
| Wisconsin | 274,780 | 482,345 | 57% |
| Oklahoma | 163,335 | 299,487 | 55% |
| Washington | 1,607,666 | 3,019,865 | 53% |
| Texas | 3,852,122 | 7,682,965 | 50% |
| Total | 20,791,159 | 34,018,574 | 61% |
Source: EWG from the USDA Cropland Data Layer, EPA Safe Drinking Water Information System and USGS Predicted Nitrate Concentration in U.S. Groundwater Used for Drinking
Cleaning up groundwater
For much of the agricultural area directly above highly susceptible aquifers, there are reasonable solutions to reduce nitrate leaching into groundwater. Planting cover crops on fields throughout the spring and fall allows nitrogen to be used at the surface, rather than leaching into the aquifers.
A recent EWG study on cover crops in Illinois showed that in the fall of 2015 and the spring of 2016, only 2.3 percent of the state’s agricultural areas had cover crops. In the 12 counties of northwest Illinois, including Erie, less than 0.5 percent of the corn fields had cover crops.
Recommendations
Water utilities are doing their best to deliver water with nitrate within the legal limits, but it’s an ever-increasing challenge. Erie is working with the USDA to install filters to reduce levels of nitrate in the village’s water systems. But it would be wiser for the USDA to prioritize practices designed to reduce nitrate loads at the source.
To keep drinking water free of contamination, it’s time for states to adopt basic standards of care for cropland. Requiring common-sense conservation practices ensures a baseline to protect source water, which can then be increased by voluntary measures. The 2018 federal Farm Bill must include a stronger conservation compact that requires farmers to adopt conservation practices to reduce polluted runoff.