NEW BERN, N.C. - Hurricane Florence’s torrential rains pelted areas of North Carolina that are home to more than 1,500 industrial animal operations with more than 1,000 nearby animal waste storage cesspools. These operations have the potential to annually produce as much as four billion gallons of wet swine waste and 400,000 tons of dry poultry waste, according to an exclusive analysis by EWG and Waterkeeper Alliance.
The organizations overlaid locations of concentrated animal feeding operations, or CAFOs, with government rainfall estimates to produce an interactive map that details Florence’s potential impact on vulnerable operations in the state. Clicking and zooming in on a location shows the estimated amount of rain each CAFO received from Sept. 14, when Florence made landfall, through Sept. 16, and the potential amount of waste produced or stored at each site.
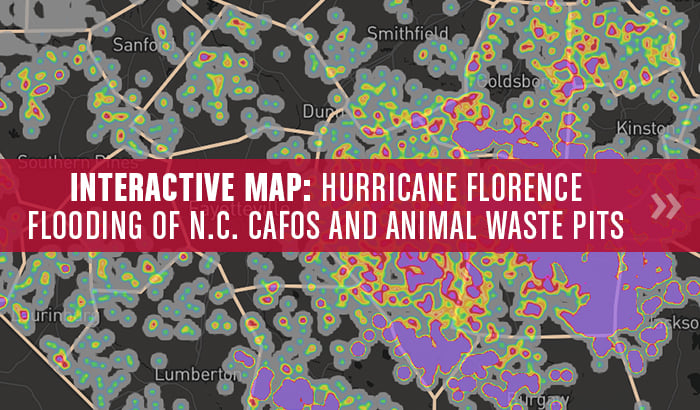
Source: EWG/Waterkeeper Alliance, from National Weather Service, USDA Agricultural Census and N.C. Dept. of Environmental Quality data
The groups calculated the potential waste stored at each site by using North Carolina permit data, the Agricultural Census from the U.S. Department of Agriculture and manure-production-rate data from the North Carolina Agricultural Chemicals Manual. A link to the methodology is here.
Among our findings:
- There are 926 concentrated animal feeding operations, or CAFOs, housing more than 3.8 million hogs and 578 poultry CAFOs holding an estimated 35 million fowl in areas where the National Weather Service said flooding was “occurring or imminent” after Florence. Livestock at those 1,504 concentrated animal feeding operations are capable of producing four billion gallons of wet waste and more than 400,000 tons of dry poultry waste each year. More than a third of those sites received an estimated 15 to 19 inches of rain, and more than one-fourth saw more than 20 inches.
- There are 123 industrial hog operations and 40 industrial poultry operations in or within 500 feet of the 100-year floodplain that received at least 15 inches of rain. Livestock at those 163 sites are capable of producing more than 395 million gallons of liquid waste and more than 27,000 tons of dry waste a year.
- Federal standards require waste pits in North Carolina to be designed to withstand a so-called 24-hour/25-year rain event without releasing manure. In areas where the National Weather Service said flooding was occurring or imminent, more than 1,000 waste pits received more rain than the 24-hour/25-year rain event defined for that location. Of those, an estimated 35 pits are in the 100-year floodplain and received over 15 inches of rain. Those pits alone are capable of holding more than 129 million gallons of animal waste.
- The map below shows colored bands of estimated rainfall amounts in North Carolina’s coastal plain from Sept. 14-16. The dark diagonal lines show the zones of rainfall expected during a 24-hour/25-year rain event. In all of the zones except for the one with the lowest expected rainfall (in blue), the total estimated rainfall was well in excess of what the waste pits were designed to withstand.
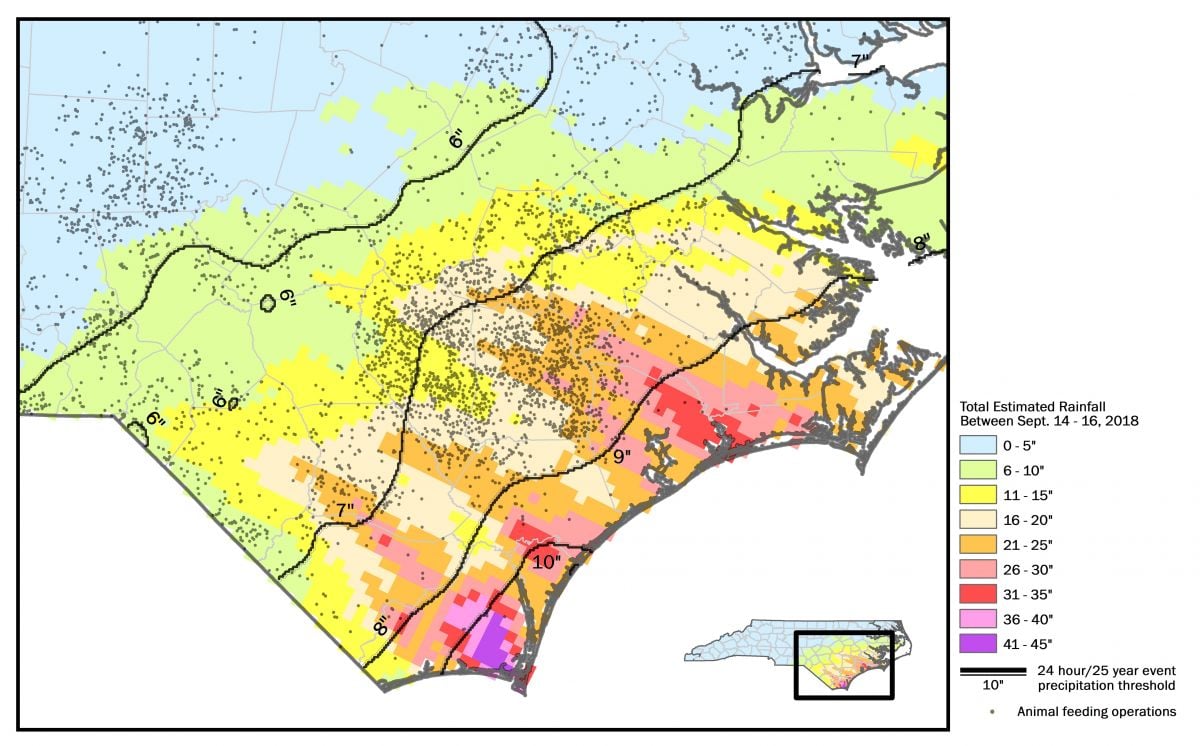
Source: EWG, from National Weather Service data
"It’s just a matter of time until another massive rain event happens again in the floodplain,” said Soren Rundquist, EWG’s director of spatial analysis. “How many scenes of swamped animal barns and breached manure pits do state leaders and the factory farm industry need to see before they realize producing and storing billions of pounds of animal waste in flood-prone areas is disastrously bad policy?”
“Waste mismanagement at industrial animal agriculture operations threatens public health and environmental quality even under sunny skies,” said Will Hendrick, staff attorney and manager of the Pure Farms, Pure Waters campaign at Waterkeeper Alliance. “That threat is disproportionately borne by communities of color or low wealth and it is exacerbated, given the concentration of production in the coastal plain, by increasingly frequent and severe storms like Hurricanes Matthew and Florence."
EWG and Waterkeeper Alliance will continue our analysis of Hurricane Florence’s impact on CAFOs in North Carolina’s coastal plain.
About EWG
The Environmental Working Group’s mission is to empower people to live healthier lives in a healthier environment. With breakthrough research and education, we drive consumer choice and civic action. EWG is a nonprofit, nonpartisan organization dedicated to protecting human health and the environment. For more information, please visit www.ewg.org.
About Waterkeeper Alliance
Waterkeeper Alliance is a global movement uniting more than 300 Waterkeeper Organizations and Affiliates around the world, focusing citizen action on issues that affect our waterways, from pollution to climate change. The Waterkeeper movement patrols and protects over 2.5 million square miles of rivers, lakes and coastlines in the Americas, Europe, Australia, Asia, and Africa. For more information, please visit waterkeeper.org
About the Map: Hurricane Florence Soaks CAFOs and Animal Waste Pits Along North Carolina’s Coastal Plain
Data provided on the maps represent estimations of locations and statistics in an attempt to accurately document CAFOs and their impact on the landscape. EWG and Waterkeeper Alliance assume no responsibility for locational accuracy, errors or omissions represented on the maps.
Animal Feeding Operation Attributes
- September 14-16, 2018 estimated rainfall: Derived from intersecting Quantitative Precipitation Forecasts (QPFs) surfaces derived by NOAA – National Weather Service, 24-Hour Forecast with approximate animal feeding operation locations.
- County: North Carolina county in which animal feeding operation exists.
- Facility Type: Animal operation category (i.e. SWINE, POULTRY, and CATTLE) from “REGULATED OPERATION” of the N.C. Department of Environmental Quality List of Permitted Animal Facilities (January 2018), or Poultry - compiled by the Waterkeeper Alliance contracted by Justin S. Quinlivan (2015).
- Estimated Animal Count: Animal count from “ALLOWABLE COUNT” of the N.C. Department of Environmental Quality List of Permitted Animal Facilities (January 2015), or aggregated count of highest number of poultry types (broiler, layer, pullet, turkey) between 2007 and 2012 from Poultry - Inventory and Sales USDA AG Census 2007 and 2012.
- Estimated Waste Output: Annual estimated waste output calculated using the 2016 North Carolina Agricultural Chemicals Manual, specifically Chapter IV-Fertilizer Use, page 62,“Livestock & Poultry Manure Production Rates and Nutrient Content.” See WASTE ESTIMATE METHODOLOGY below for more information.
Lagoon Attributes
Waste Lagoons - Data representing the perimeter measurements of waste lagoons were compiled by EWG. Lagoons polygons were heads-up digitized using 2014 USDA NAIP aerial photography. The North Carolina Department of Environment and Natural Resources Division of Water Quality Swine Lagoon point layer served as a proxy for known swine lagoons. Visible lagoons on aerial photography not marked with the N.C. point layer were also capture and classified as unknown.
- September 14-16, 2018 estimated rainfall: Derived from intersecting Quantitative Precipitation Forecasts (QPFs) surfaces with the derived by NOAA – National Weather Service, 24-Hour Forecast.
- Area: Square acres of lagoon surface.
- Exceeded 14 hour 25 year event: Derived from intersecting Quantitative Precipitation Forecasts (QPFs) surfaces with Isopluvials of 24 hour precipitation (inches) with Average Recurrence Interval of 25 years both derived by NOAA – National Weather Service, 24-Hour Forecast.
- Estimated storage volume: Derived by taking the square footage (Length x Width) x Average Depth (assumed 8 ft.) x Volume in US Gallons per cubic foot (7.5)
Waste Estimate Methodology
Poultry Waste Estimates
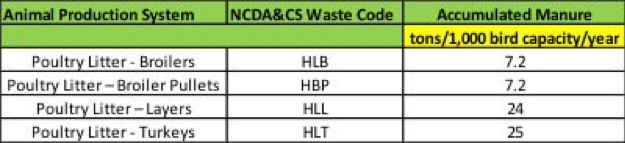
To calculate poultry waste, EWG took the highest county-level estimates found in the USDA Agricultural Census between 2007 and 2012 for “Pullet,” “Turkey,” “Layer” and “Broiler.” Those county-level numbers were then evenly distributed by the number of poultry barns associated with an individual operation in the county, as documented by Waterkeeper Alliance. Manure outputs were calculated using the specific poultry type and count from the 2016 North Carolina Agricultural Chemicals Manual, specifically Chapter IV-Fertilizer Use, page 62, “Livestock & Poultry Manure Production Rates and Nutrient Content” (see Figure 1 below).
FIGURE 1- MANURE VOLUME AND WEIGHT IN TYPICAL NORTH CAROLINA ANIMAL PRODUCTION SYSTEMS
Swine Waste Estimates
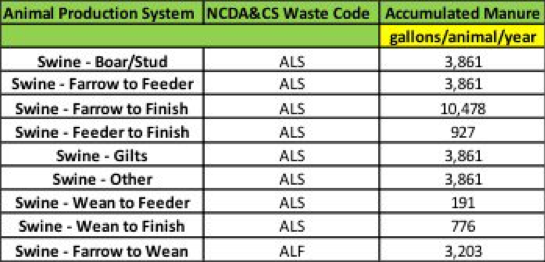
To calculate swine waste, EWG used permit data from the North Carolina Department of Environmental Quality to determine animal type and count. Manure outputs were calculated using the specific type and count from the 2016 North Carolina Agricultural Chemicals Manual, specifically Chapter IV-Fertilizer Use, page 62, "Livestock & Poultry Manure Production Rates and Nutrient Content." For animal types that did not appear on the 2016 North Carolina Agricultural Chemicals Manual, EWG used manure metrics for a similar type of animal. This was done for Swine - Boar/Stud, Swine – Gilts, and Swine – Other (see Figure 2 below).
FIGURE 2- - MANURE VOLUME AND WEIGHT IN TYPICAL NORTH CAROLINA ANIMAL PRODUCTION SYSTEMS
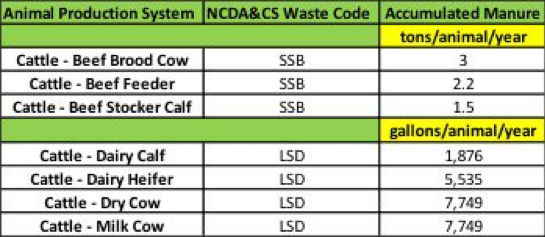
Cattle Waste Estimates
To calculate cattle waste, EWG used the permit data from the North Carolina Department of Environmental Quality to determine animal type and count. EWG manure outputs were calculated using the specific type and count from the 2016 North Carolina Agricultural Chemicals Manual, specifically Chapter IV-Fertilizer Use, page 62, “Livestock & Poultry Manure Production Rates and Nutrient Content.” For animal types that did not appear on the 2016 North Carolina Agricultural Chemicals Manual, EWG used manure metrics for a similar type of animal. This was done for Cattle - Dry Cow (see Figure 3 below).
FIGURE 3- - MANURE VOLUME AND WEIGHT IN TYPICAL NORTH CAROLINA ANIMAL PRODUCTION SYSTEMS