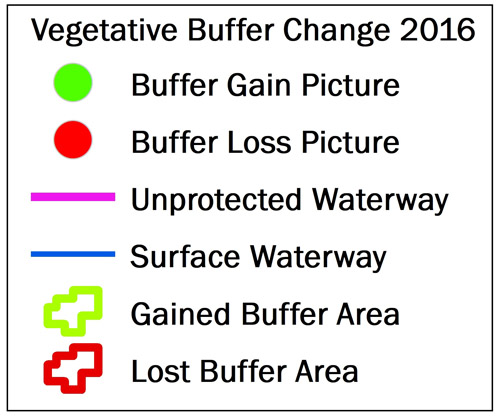


The map displays areas where vegetative buffers within 100 feet of the shoreline were gained or lost between 2010 and 2011, and between 2015 and 2016. Unprotected stream segments that had no visible vegetative buffer the spring of 2015 to 2016 are also visible.
The buffer universe was created by using a 100-foot and 50-foot distance from all agricultural waterways so long as it intersected with Common Land Unit classified as agriculture.
Buffer vegetation was detected using the Normalized Difference Vegetative Index calculated from 5-meter resolution Rapid Eye imagery from Planet.
River and stream flowlines were derived from The U.S. Geological Survey national hydrography dataset, the Iowa Department of Natural Resources channelized stream layer, and the Iowa Flood Center top-of-bank data.
Before and after images display data from Google Earth, the Department of Agriculture’s National Agriculture Imagery Program, Digital Globe and Planet.